Pitney Bowes 2013 Annual Report Download - page 52
Download and view the complete annual report
Please find page 52 of the 2013 Pitney Bowes annual report below. You can navigate through the pages in the report by either clicking on the pages listed below, or by using the keyword search tool below to find specific information within the annual report.-
 1
1 -
2
-
3
-
4
-
5
-
6
-
7
-
8
-
9
-
10
-
11
-
12
-
13
-
14
-
15
-
16
-
17
-
18
-
19
-
20
-
21
-
22
-
23
-
24
-
25
-
26
-
27
-
28
-
29
-
30
-
31
-
32
-
33
-
34
-
35
-
36
-
37
-
38
-
39
-
40
-
41
-
 42
42 -
 43
43 -
 44
44 -
 45
45 -
 46
46 -
 47
47 -
 48
48 -
 49
49 -
 50
50 -
 51
51 -
 52
52 -
 53
53 -
 54
54 -
 55
55 -
 56
56 -
 57
57 -
 58
58 -
 59
59 -
 60
60 -
 61
61 -
 62
62 -
63
-
64
-
65
-
66
-
67
-
68
-
69
-
70
-
71
-
72
-
73
-
74
-
75
-
76
-
77
-
78
-
79
-
80
-
81
-
82
-
83
-
84
-
85
-
86
-
87
-
88
-
89
-
90
-
91
-
92
-
93
-
94
-
95
-
96
-
97
-
98
-
99
-
100
-
101
-
102
-
103
-
104
-
105
-
106
-
107
-
108
-
109
-
110
-
111
-
112
-
113
-
114
-
115
-
116
 |
 |

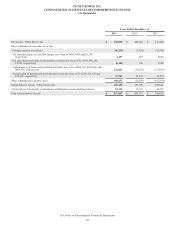
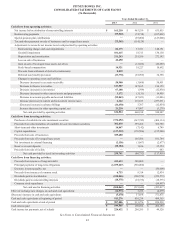
PITNEY BOWES INC.
CONSOLIDATED STATEMENTS OF CASH FLOWS
(In thousands)
41
Years Ended December 31,
2013 2012 2011
Cash flows from operating activities:
Net income before attribution of noncontrolling interests $ 161,210 $ 463,539 $ 635,855
Restructuring payments (59,520) (74,718) (107,002)
Special pension plan contributions —(95,000) (123,000)
Tax and other payments on sale of businesses and leveraged lease assets (75,545) (114,128) —
Adjustments to reconcile net income to net cash provided by operating activities:
Restructuring charges and asset impairments 86,175 33,351 148,151
Goodwill impairment 101,415 18,315 130,150
Depreciation and amortization 211,243 255,556 272,142
Loss on sale of businesses 42,450 ——
Gain on sale of leveraged lease assets, net of tax —(12,886) (26,689)
Stock-based compensation 14,921 18,227 18,692
Proceeds from settlement of derivative instruments 8,059 ——
Deferred tax (benefit) provision (33,770) (92,999) 34,358
Changes in operating assets and liabilities:
Decrease (increase) in accounts receivable 58,980 (3,068) 58,951
Decrease in finance receivables 123,587 147,165 190,153
Decrease (increase) in inventories 67,188 (599) (12,830)
Decrease (increase) in other current assets and prepayments 3,172 (3,131) 16,905
Decrease in accounts payable and accrued liabilities (95,843) (47,023) (13,086)
in current and non-current income taxes 6,322 116,013 (257,631)
(Decrease) increase in advance billings (16,450) 3,767 (12,854)
Increase (decrease) in other operating capital, net 21,230 47,807 (3,278)
Net cash provided by operating activities 624,824 660,188 948,987
Cash flows from investing activities:
Purchases of available-for-sale investment securities (376,652) (367,745) (406,114)
Proceeds from sales/maturities of available-for-sale investment securities 382,638 359,266 302,785
Short-term and other investments 14,847 (7,142) 6,749
Capital expenditures (137,512) (176,586) (155,980)
Proceeds from sale of businesses 389,680 ——
Proceeds from sale of leveraged lease assets —105,506 101,784
Net investment in external financing (2,156) (1,667) (2,677)
Reserve account deposits (20,104) 1,636 35,354
Proceeds from sale of facility —— 683
Net cash provided by (used in) investing activities 250,741 (86,732) (117,416)
Cash flows from financing activities:
Proceeds from issuance of long-term debt 411,613 340,000 —
Principal payments of long-term obligations (1,079,207) (550,000) —
Decrease in notes payable, net —— (50,000)
Proceeds from issuance of common stock 6,753 9,314 12,934
Dividends paid to stockholders (188,846) (300,578) (299,579)
Dividends paid to noncontrolling interests (18,375) (18,376) (18,375)
Common stock repurchases —— (99,997)
Net cash used in financing activities (868,062) (519,640) (455,017)
Effect of exchange rate changes on cash and cash equivalents (12,973) 3,222 (4,679)
(Decrease) increase in cash and cash equivalents (5,470) 57,038 371,875
Cash and cash equivalents at beginning of period 913,276 856,238 484,363
Cash and cash equivalents at end of period $ 907,806 $ 913,276 $ 856,238
Cash interest paid $ 199,505 $ 190,892 $ 202,159
Cash income tax payments, net of refunds $ 224,432 $ 206,285 $ 44,528
See Notes to Consolidated Financial Statements
Increase (decrease)