Pitney Bowes 2013 Annual Report Download - page 25
Download and view the complete annual report
Please find page 25 of the 2013 Pitney Bowes annual report below. You can navigate through the pages in the report by either clicking on the pages listed below, or by using the keyword search tool below to find specific information within the annual report.-
 1
1 -
2
-
3
-
4
-
5
-
6
-
7
-
8
-
9
-
10
-
11
-
12
-
13
-
14
-
 15
15 -
 16
16 -
 17
17 -
 18
18 -
 19
19 -
 20
20 -
 21
21 -
 22
22 -
 23
23 -
 24
24 -
 25
25 -
 26
26 -
 27
27 -
 28
28 -
 29
29 -
 30
30 -
 31
31 -
 32
32 -
 33
33 -
 34
34 -
 35
35 -
36
-
37
-
38
-
39
-
40
-
41
-
42
-
43
-
44
-
45
-
46
-
47
-
48
-
49
-
50
-
51
-
52
-
53
-
54
-
55
-
56
-
57
-
58
-
59
-
60
-
61
-
62
-
63
-
64
-
65
-
66
-
67
-
68
-
69
-
70
-
71
-
72
-
73
-
74
-
75
-
76
-
77
-
78
-
79
-
80
-
81
-
82
-
83
-
84
-
85
-
86
-
87
-
88
-
89
-
90
-
91
-
92
-
93
-
94
-
95
-
96
-
97
-
98
-
99
-
100
-
101
-
102
-
103
-
104
-
105
-
106
-
107
-
108
-
109
-
110
-
111
-
112
-
113
-
114
-
115
-
116
 |
 |

14
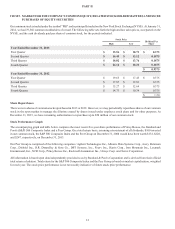
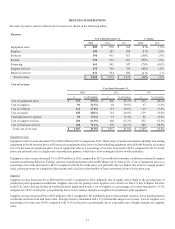
ITEM 6. SELECTED FINANCIAL DATA
Amounts in the table below have been recast to reflect the results of PBMS, the Nordic furniture business and IMS as discontinued
operations (see Note 19 to the Consolidated Financial Statements). The following table of selected financial data should be read in
conjunction with the more detailed consolidated financial statements and related notes thereto included in Item 8 of this Form 10-K.
Years Ended December 31,
2013 2012 2011 2010 2009
Total revenue $ 3,869,401 $ 3,915,064 $ 4,125,341 $ 4,217,505 $ 4,270,267
Amounts attributable to common stockholders:
Net income from continuing operations $ 301,733 $ 395,684 $ 437,593 $ 263,444 $ 343,051
(Loss) income from discontinued operations (158,898)49,479 179,887 28,935 80,394
Net income - Pitney Bowes Inc. $ 142,835 $ 445,163 $ 617,480 $ 292,379 $ 423,445
Basic earnings per share attributable to common stockholders (1):
Continuing operations $ 1.50 $ 1.97 $ 2.17 $ 1.27 $ 1.66
Discontinued operations (0.79)0.25 0.89 0.15 0.39
Net income - Pitney Bowes Inc. $ 0.71 $ 2.22 $ 3.06 $ 1.42 $ 2.05
Diluted earnings per share attributable to common stockholders (1):
Continuing operations $ 1.49 $ 1.96 $ 2.16 $ 1.27 $ 1.65
Discontinued operations (0.78)0.25 0.89 0.14 0.39
Net income - Pitney Bowes Inc. $ 0.70 $ 2.21 $ 3.05 $ 1.41 $ 2.04
Cash dividends paid per share of common stock $ 0.9375 $ 1.50 $ 1.48 $ 1.46 $ 1.44
Balance sheet data:
December 31,
2013 2012 2011 2010 2009
Total assets $ 6,772,708 $ 7,859,891 $ 8,147,104 $ 8,444,023 $ 8,571,039
Long-term debt $ 3,346,295 $ 3,642,375 $ 3,683,909 $ 4,239,248 $ 4,213,640
Total debt $ 3,346,295 $ 4,017,375 $ 4,233,909 $ 4,289,248 $ 4,439,662
Noncontrolling interests (Preferred stockholders'
equity in subsidiaries) $ 296,370 $ 296,370 $ 296,370 $ 296,370 $ 296,370
(1) The sum of earnings per share may not equal the totals due to rounding.