Pitney Bowes 2013 Annual Report Download - page 9
Download and view the complete annual report
Please find page 9 of the 2013 Pitney Bowes annual report below. You can navigate through the pages in the report by either clicking on the pages listed below, or by using the keyword search tool below to find specific information within the annual report.-
 1
1 -
 2
2 -
 3
3 -
 4
4 -
 5
5 -
 6
6 -
 7
7 -
 8
8 -
 9
9 -
 10
10 -
 11
11 -
 12
12 -
 13
13 -
 14
14 -
 15
15 -
 16
16 -
 17
17 -
 18
18 -
 19
19 -
 20
20 -
21
-
22
-
23
-
24
-
25
-
26
-
27
-
28
-
29
-
30
-
31
-
32
-
33
-
34
-
35
-
36
-
37
-
38
-
39
-
40
-
41
-
42
-
43
-
44
-
45
-
46
-
47
-
48
-
49
-
50
-
51
-
52
-
53
-
54
-
55
-
56
-
57
-
58
-
59
-
60
-
61
-
62
-
63
-
64
-
65
-
66
-
67
-
68
-
69
-
70
-
71
-
72
-
73
-
74
-
75
-
76
-
77
-
78
-
79
-
80
-
81
-
82
-
83
-
84
-
85
-
86
-
87
-
88
-
89
-
90
-
91
-
92
-
93
-
94
-
95
-
96
-
97
-
98
-
99
-
100
-
101
-
102
-
103
-
104
-
105
-
106
-
107
-
108
-
109
-
110
-
111
-
112
-
113
-
114
-
115
-
116
 |
 |

7Pitney Bowes Annual Report 2013
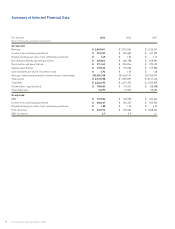
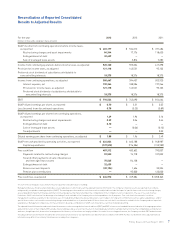
Reconciliation of Reported Consolidated
Results to Adjusted Results
For the year 2013 2012 2011
(Dollars in thousands, except per share amounts)
GAAP income from continuing operations before income taxes,
as reported $ 403,177 $ 534,312 $ 491,486
Restructuring charges and asset impairments 84,344 17,176 118,630
Extinguishment of debt 32,639 — —
Sale of leveraged lease assets — 3,816 7,282
Income from continuing operations before income taxes, as adjusted 520,160 555,304 617,398
Provision for income taxes, as adjusted 121,118 142,521 95,103
Preferred stock dividends of subsidiaries attributable to
noncontrolling interests 18,375 18,376 18,375
Income from continuing operations, as adjusted 380,667 394,407 503,920
Interest expense, net 190,364 188,386 197,266
Provision for income taxes, as adjusted 121,118 142,521 95,103
Preferred stock dividends of subsidiaries attributable to
noncontrolling interests 18,375 18,376 18,375
EBIT $ 710,524 $ 743,690 $ 814,664
GAAP diluted earnings per share, as reported $ 0.70 $ 2.21 $ 3.05
Loss (income) from discontinued operations 0.78 (0.25) (0.89)
GAAP diluted earnings per share from continuing operations,
as reported 1.49 1.96 2.16
Restructuring charges and asset impairments 0.29 0.06 0.44
Extinguishment of debt 0.10 — —
Sale of leveraged lease assets — (0.06) (0.13)
Tax adjustments — — 0.02
Diluted earnings per share from continuing operations, as adjusted $ 1.88 $ 1.96 $ 2.49
GAAP net cash provided by operating activities, as reported $ 624,824 $ 660,188 $ 948,987
Capital expenditures (137,512) (176,586) (155,980)
Free cash flow 487,312 483,602 793,007
Payments related to restructuring charges 59,520 74,718 107,002
Tax and other payments on sale of businesses
and leveraged lease assets 75,545 114,128 —
Extinguishment of debt 32,639 — —
Reserve account deposits (20,104) 1,636 35,354
Pension plan contributions — 95,000 123,000
Free cash flow, as adjusted $ 634,912 $ 769,084 $ 1,058,363
The sum of the earnings per share amounts may not equal the totals above due to rounding.
Management believes this presentation provides a reasonable basis on which to present the adjusted fi nancial information. The Company’s fi nancial results are reported in accordance
with generally accepted accounting principles (GAAP). The earnings per share and free cash fl ow results are adjusted to exclude the impact of special items such as restructuring charges,
asset and goodwill impairment charges and other income and expense that materially impact the comparability of the Company’s results of operations. The use of free cash fl ow has
limitations. GAAP cash fl ow has the advantage of including all cash available to the Company after actual expenditures for all purposes. Free cash fl ow is the amount of cash that
management could have available for discretionary uses if it made different decisions about employing its cash. It adjusts for long-term commitments such as capital expenditures, and for
special items such as cash used for restructuring charges and contributions to its pension funds. All these items use cash that is not otherwise available to the Company and are important
expenditures. Management compensates for these limitations by using a combination of GAAP cash fl ow and free cash fl ow in doing its planning.
The adjusted fi nancial information and certain fi nancial measures such as earnings before interest and taxes (EBIT) and EBIT to interest are intended to be more indicative of the ongoing operations
and economic results of the Company. EBIT excludes interest and taxes and, as a result, has the effect of showing a greater amount of earnings than net income. The Company believes that interest
and taxes, though important, do not refl ect management effectiveness, as these items are largely outside of its control. In assessing performance, the Company uses both EBIT and net income.
This adjusted fi nancial information should not be construed as an alternative to our reported results determined in accordance with GA AP. Further, our defi nition of this adjusted fi nancial
information may differ from similarly titled measures used by other companies.