Pitney Bowes 2013 Annual Report Download - page 29
Download and view the complete annual report
Please find page 29 of the 2013 Pitney Bowes annual report below. You can navigate through the pages in the report by either clicking on the pages listed below, or by using the keyword search tool below to find specific information within the annual report.-
 1
1 -
2
-
3
-
4
-
5
-
6
-
7
-
8
-
9
-
10
-
11
-
12
-
13
-
14
-
15
-
16
-
17
-
18
-
 19
19 -
 20
20 -
 21
21 -
 22
22 -
 23
23 -
 24
24 -
 25
25 -
 26
26 -
 27
27 -
 28
28 -
 29
29 -
 30
30 -
 31
31 -
 32
32 -
 33
33 -
 34
34 -
 35
35 -
 36
36 -
 37
37 -
 38
38 -
 39
39 -
40
-
41
-
42
-
43
-
44
-
45
-
46
-
47
-
48
-
49
-
50
-
51
-
52
-
53
-
54
-
55
-
56
-
57
-
58
-
59
-
60
-
61
-
62
-
63
-
64
-
65
-
66
-
67
-
68
-
69
-
70
-
71
-
72
-
73
-
74
-
75
-
76
-
77
-
78
-
79
-
80
-
81
-
82
-
83
-
84
-
85
-
86
-
87
-
88
-
89
-
90
-
91
-
92
-
93
-
94
-
95
-
96
-
97
-
98
-
99
-
100
-
101
-
102
-
103
-
104
-
105
-
106
-
107
-
108
-
109
-
110
-
111
-
112
-
113
-
114
-
115
-
116
 |
 |

18
Software
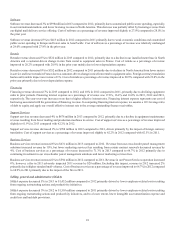
Software revenue decreased 3% to $398 million in 2013 compared to 2012, primarily due to constrained public sector spending, especially
in our international markets, and lower licensing revenue in North America. This decrease was partially offset by licensing revenue from
our digital mail delivery service offering. Cost of software as a percentage of revenue improved slightly to 27.8% compared to 28.0% in
the prior year.
Software revenue decreased 3% to $413 million in 2012 compared to 2011 primarily due to weak economic conditions and constrained
public sector spending in Europe and lower sales in Asia Pacific. Cost of software as a percentage of revenue was relatively unchanged
at 28.0% compared with 27.8% in the prior year.
Rentals
Rentals revenue decreased 5% to $522 million in 2013 compared to 2012, primarily due to a decline in our installed meter base in North
America and a customer-driven change in mix from rental to equipment sales in France. Cost of rentals as a percentage of revenue
improved to 20.2% compared with 20.9% in the prior year mainly due to lower depreciation expense.
Rentals revenue decreased 8% to $552 million in 2012 compared to 2011 primarily due to declines in North America from fewer meters
in service and lower rentals in France due to a customer-driven change in mix from rental to equipment sales. Foreign currency translation
had an unfavorable impact on revenue of 1%. Cost of rentals as a percentage of revenue improved to 20.9% compared with 23.0% in the
prior year primarily due to lower depreciation expense.
Financing
Financing revenue decreased 7% in 2013 compared to 2012, and 10% in 2012 compared to 2011, primarily due to declining equipment
sales in prior periods. Financing interest expense as a percentage of revenue was 17.6%, 16.4% and 16.0% in 2013, 2012 and 2011,
respectively. The year-over-year increases were due to higher effective interest rates. Financing interest expense represents our cost of
borrowing associated with the generation of financing revenue. In computing financing interest expense, we assume a 10:1 leverage ratio
of debt to equity and apply our overall effective interest rate to the average outstanding finance receivables.
Support Services
Support services revenue decreased 4% to $678 million in 2013 compared to 2012, primarily due to a decline in equipment maintenance
revenue resulting from fewer mailing and production machines in service. Cost of support services as a percentage of revenue improved
slightly to 61.9% in 2013 compared with 62.2% in 2012.
Support services revenue decreased 2% to $708 million in 2012 compared to 2011, driven primarily by the impact of foreign currency
translation. Cost of support services as a percentage of revenue improved slightly to 62.2% in 2012 compared with 62.5% in 2011.
Business Services
Business services revenue increased 6% to $631 million in 2013 compared to 2012. Revenue from our cross-border parcel management
solutions increased revenue by 10%, but lower marketing services fees resulting from certain contract renewals decreased revenue by
4%. Cost of business services as a percentage of revenue increased to 71.3% in 2013 compared to 66.7% in 2012 primarily due to
continuing investment in our cross-border parcel management solutions and lower marketing services fees.
Business services revenue increased 2% to $594 million in 2012 compared to 2011. Revenue in our Presort Services operation increased
8%; however, a fire in 2011 adversely impacted 2011 revenue by $20 million. Excluding this impact, revenue in 2012 increased 2%
primarily due to higher standard mail volumes. Cost of business services as a percentage of revenue improved to 66.7% in 2012 compared
to 68.9% in 2011 primarily due to the impact of the fire in 2011.
Selling, general and administrative (SG&A)
SG&A expense decreased 5% in 2013 to $1,432 million compared to 2012 primarily driven by lower employee-related costs resulting
from ongoing restructuring actions and productivity initiatives.
SG&A expense decreased 5% in 2012 to $1,503 million compared to 2011 primarily driven by lower employee-related costs resulting
from ongoing restructuring actions and productivity initiatives, and to a lesser extent, lower intangible asset amortization expense and
credit loss and bad debt provisions.