Pitney Bowes 2013 Annual Report Download - page 76
Download and view the complete annual report
Please find page 76 of the 2013 Pitney Bowes annual report below. You can navigate through the pages in the report by either clicking on the pages listed below, or by using the keyword search tool below to find specific information within the annual report.-
 1
1 -
2
-
3
-
4
-
5
-
6
-
7
-
8
-
9
-
10
-
11
-
12
-
13
-
14
-
15
-
16
-
17
-
18
-
19
-
20
-
21
-
22
-
23
-
24
-
25
-
26
-
27
-
28
-
29
-
30
-
31
-
32
-
33
-
34
-
35
-
36
-
37
-
38
-
39
-
40
-
41
-
42
-
43
-
44
-
45
-
46
-
47
-
48
-
49
-
50
-
51
-
52
-
53
-
54
-
55
-
56
-
57
-
58
-
59
-
60
-
61
-
62
-
63
-
64
-
65
-
 66
66 -
 67
67 -
 68
68 -
 69
69 -
 70
70 -
 71
71 -
 72
72 -
 73
73 -
 74
74 -
 75
75 -
 76
76 -
 77
77 -
 78
78 -
 79
79 -
 80
80 -
 81
81 -
 82
82 -
 83
83 -
 84
84 -
 85
85 -
 86
86 -
87
-
88
-
89
-
90
-
91
-
92
-
93
-
94
-
95
-
96
-
97
-
98
-
99
-
100
-
101
-
102
-
103
-
104
-
105
-
106
-
107
-
108
-
109
-
110
-
111
-
112
-
113
-
114
-
115
-
116
 |
 |

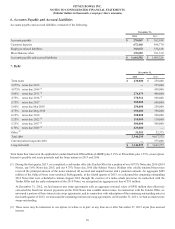
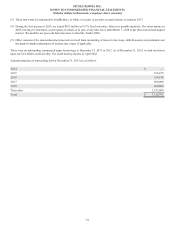
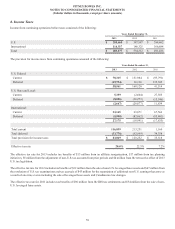
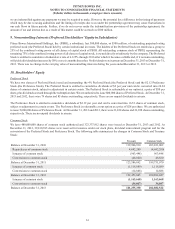
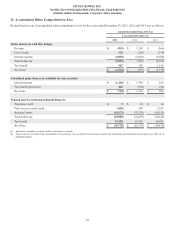
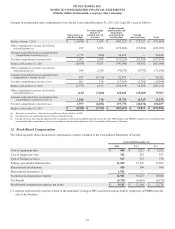
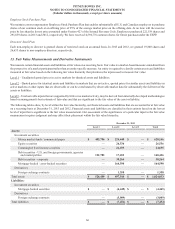
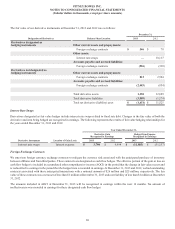
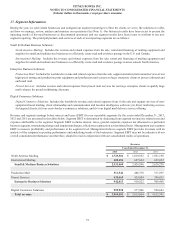
PITNEY BOWES INC.
NOTES TO CONSOLIDATED FINANCIAL STATEMENTS
(Tabular dollars in thousands, except per share amounts)
65
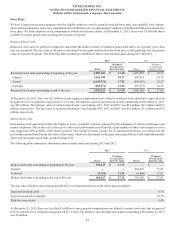
Stock Options
We may also grant stock options to certain officers and employees at an exercise price equal to the stock price of our common stock on
the grant date. Options vest ratably over three or four years and expire ten years from the date of grant.
The following table summarizes information about stock option activity during 2013 and 2012:
2013 2012
Shares
Per share
weighted
average
exercise prices Shares
Per share
weighted
average exercise
prices
Options outstanding at beginning of the year 13,653,245 $ 35.28 14,471,464 $ 36.42
Granted 800,000 21.93 600,000 15.71
Exercised (35,461) 22.09 ——
Canceled (628,731) 32.93 (525,361) 36.15
Expired (1,392,159) 32.39 (892,858) 40.20
Options outstanding at the end of the year 12,396,894 $ 34.90 13,653,245 $ 35.28
Options exercisable at the end of the year 10,864,753 $ 36.84 11,762,341 $ 37.44
At December 31, 2013, there was $1 million of unrecognized compensation cost related to stock options that is expected to be recognized
over a weighted-average period of 2.8 years. The intrinsic value of options outstanding and options exercisable at December 31, 2013
was $7 million and $3 million, respectively. The intrinsic value of options exercised during 2013 was not material.
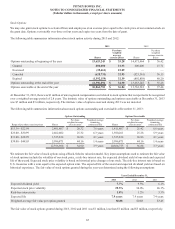
The following table summarizes information about stock options outstanding and exercisable at December 31, 2013:
Options Outstanding Options Exercisable
Range of per share exercise prices Shares
Per share
weighted-average
exercise price
Weighted-average
remaining
contractual life Shares
Per share
weighted-average
exercise price
Weighted-average
remaining
contractual life
$13.39 - $22.99 2,401,807 $ 20.32 7.6 years 1,411,807 $ 21.42 6.6 years
$23.00 - $30.99 2,462,402 25.32 6.3 years 1,920,261 25.28 5.9 years
$31.00 - $38.99 1,535,814 36.86 4.1 years 1,535,814 36.86 4.1 years
$39.00 - $48.03 5,996,871 44.16 1.4 years 5,996,871 44.16 1.4 years
12,396,894 $ 34.90 3.9 years 10,864,753 $ 36.84 3.3 years
We estimate the fair value of stock options using a Black-Scholes valuation model. Key input assumptions used to estimate the fair value
of stock options include the volatility of our stock price, a risk-free interest rate, the expected dividend yield of our stock and expected
life of the award. Expected stock price volatility is based on historical price changes of our stock. The risk-free interest rate is based on
U.S. treasuries with a term equal to the expected option term. The expected life of the award and expected dividend yield are based on
historical experience. The fair value of stock options granted during the year was determined using the following assumptions:
Years Ended December 31,
2013 2012 2011
Expected dividend yield 7.7% 9.3% 6.1%
Expected stock price volatility 29.5% 30.0% 26.1%
Risk-free interest rate 1.8% 1.2% 3.3%
Expected life 7.9 years 7.9 years 7.4 years
Weighted-average fair value per option granted $0.88 $0.48 $3.45
The fair value of stock options granted during 2013, 2012 and 2011 was $1 million, less than $1 million and $5 million, respectively.