Pitney Bowes 2013 Annual Report Download - page 93
Download and view the complete annual report
Please find page 93 of the 2013 Pitney Bowes annual report below. You can navigate through the pages in the report by either clicking on the pages listed below, or by using the keyword search tool below to find specific information within the annual report.-
 1
1 -
2
-
3
-
4
-
5
-
6
-
7
-
8
-
9
-
10
-
11
-
12
-
13
-
14
-
15
-
16
-
17
-
18
-
19
-
20
-
21
-
22
-
23
-
24
-
25
-
26
-
27
-
28
-
29
-
30
-
31
-
32
-
33
-
34
-
35
-
36
-
37
-
38
-
39
-
40
-
41
-
42
-
43
-
44
-
45
-
46
-
47
-
48
-
49
-
50
-
51
-
52
-
53
-
54
-
55
-
56
-
57
-
58
-
59
-
60
-
61
-
62
-
63
-
64
-
65
-
66
-
67
-
68
-
69
-
70
-
71
-
72
-
73
-
74
-
75
-
76
-
77
-
78
-
79
-
80
-
81
-
82
-
 83
83 -
 84
84 -
 85
85 -
 86
86 -
 87
87 -
 88
88 -
 89
89 -
 90
90 -
 91
91 -
 92
92 -
 93
93 -
 94
94 -
 95
95 -
 96
96 -
 97
97 -
 98
98 -
 99
99 -
 100
100 -
 101
101 -
 102
102 -
 103
103 -
104
-
105
-
106
-
107
-
108
-
109
-
110
-
111
-
112
-
113
-
114
-
115
-
116
 |
 |

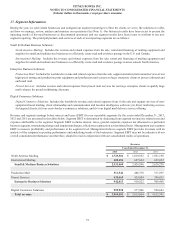
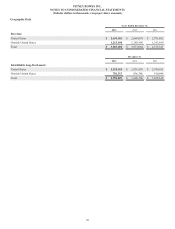
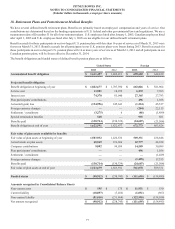
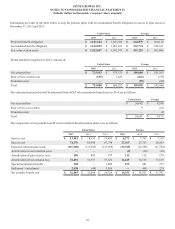
PITNEY BOWES INC.
NOTES TO CONSOLIDATED FINANCIAL STATEMENTS
(Tabular dollars in thousands, except per share amounts)
82
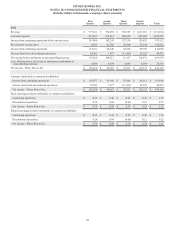
December 31, 2012
Level 1 Level 2 Level 3 Total
Money market funds $ — $ 17,363 $ — $ 17,363
Equity securities 250,303 203,766 — 454,069
Commingled fixed income securities — 200,899 — 200,899
Debt securities - U.S. and foreign governments, agencies and
municipalities 53,984 35,461 — 89,445
Debt securities - corporate — 621,691 — 621,691
Mortgage-backed securities — 39,552 3,191 42,743
Asset-backed securities — 547 — 547
Private equity — — 91,805 91,805
Real estate — — 63,168 63,168
Securities lending collateral (1) — 104,375 — 104,375
Total plan assets at fair value $ 304,287 $ 1,223,654 $ 158,164 $ 1,686,105
Securities lending payable (1) (104,375)
Cash 618
Other 1,584
Fair value of plan assets available for benefits $ 1,583,932
(1) Securities lending collateral is offset by a corresponding securities lending payable amount.
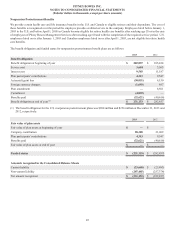
Foreign Plans
December 31, 2013
Level 1 Level 2 Level 3 Total
Money market funds $ — $ 6,058 $ — $ 6,058
Equity securities 109,403 257,046 — 366,449
Commingled fixed income securities — 104,070 — 104,070
Debt securities - U.S. and foreign governments, agencies and
municipalities — 60,204 — 60,204
Debt securities - corporate — 17,944 — 17,944
Total plan assets at fair value $ 109,403 $ 445,322 $ — $ 554,725
Cash 5,285
Other 1,068
Fair value of plan assets available for benefits $ 561,078