Pitney Bowes 2013 Annual Report Download - page 28
Download and view the complete annual report
Please find page 28 of the 2013 Pitney Bowes annual report below. You can navigate through the pages in the report by either clicking on the pages listed below, or by using the keyword search tool below to find specific information within the annual report.-
 1
1 -
2
-
3
-
4
-
5
-
6
-
7
-
8
-
9
-
10
-
11
-
12
-
13
-
14
-
15
-
16
-
17
-
 18
18 -
 19
19 -
 20
20 -
 21
21 -
 22
22 -
 23
23 -
 24
24 -
 25
25 -
 26
26 -
 27
27 -
 28
28 -
 29
29 -
 30
30 -
 31
31 -
 32
32 -
 33
33 -
 34
34 -
 35
35 -
 36
36 -
 37
37 -
 38
38 -
39
-
40
-
41
-
42
-
43
-
44
-
45
-
46
-
47
-
48
-
49
-
50
-
51
-
52
-
53
-
54
-
55
-
56
-
57
-
58
-
59
-
60
-
61
-
62
-
63
-
64
-
65
-
66
-
67
-
68
-
69
-
70
-
71
-
72
-
73
-
74
-
75
-
76
-
77
-
78
-
79
-
80
-
81
-
82
-
83
-
84
-
85
-
86
-
87
-
88
-
89
-
90
-
91
-
92
-
93
-
94
-
95
-
96
-
97
-
98
-
99
-
100
-
101
-
102
-
103
-
104
-
105
-
106
-
107
-
108
-
109
-
110
-
111
-
112
-
113
-
114
-
115
-
116
 |
 |

17
RESULTS OF OPERATIONS
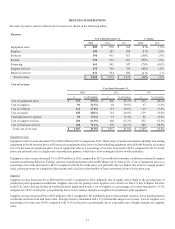
Revenue by source and the related cost of revenue are shown in the following tables:
Revenue
Year Ended December 31, % change
2013 2012 2011 2013 2012
Equipment sales $ 889 $ 870 $ 938 2% (7)%
Supplies 290 283 308 2% (8)%
Software 398 413 427 (3)% (3)%
Rentals 522 552 601 (5)% (8)%
Financing 461 495 547 (7)% (10)%
Support services 678 708 724 (4)% (2)%
Business services 631 594 580 6% 2%
Total revenue $ 3,869 $ 3,915 $ 4,125 (1)% (5)%
Cost of revenue
Year Ended December 31,
2013 2012 2011
$ % of revenue $ % of revenue $ % of revenue
Cost of equipment sales $ 439 49.4% $ 402 46.2 % $ 414 44.2%
Cost of supplies 91 31.5% 88 30.9 % 97 31.6%
Cost of software 111 27.8% 115 28.0 % 119 27.8%
Cost of rentals 105 20.2% 115 20.9 % 139 23.0%
Financing interest expense 81 17.6% 81 16.4 % 88 16.0%
Cost of support services 420 61.9% 440 62.2 % 452 62.5%
Cost of business services 450 71.3% 396 66.7 % 400 68.9%
Total cost of revenue $ 1,697 43.9% $ 1,637 41.8 % $ 1,709 41.4%
Equipment sales
Equipment sales revenue increased 2% to $889 million in 2013 compared to 2012. Higher sales of production printers globally and sorting
equipment in North America drove a 4% increase in equipment sales; however, lower mailing equipment sales in North America accounted
for a 2% decrease in equipment sales. Cost of equipment sales as a percentage of revenue increased to 49.4% compared to 46.2% in the
prior year primarily due to a higher mix of production printers, which have a lower margin relative to other products.
Equipment sales revenue decreased 7% to $87 million in 2012 compared to 2011 as worldwide economic conditions continued to impact
customer purchasing behavior. Foreign currency translation had an unfavorable impact on revenue of 1%. Cost of equipment sales as a
percentage of revenue increased to 46.2% compared with 44.2% in the prior year primarily due to a higher mix of lower margin product
sales, pricing pressure on competitive placements and a decline in the number of lease extensions relative to the prior year.
Supplies
Supplies revenue increased 2% to $290 million in 2013 compared to 2012, primarily due to supply sales related to the growing base of
production print equipment installations. Supplies sales for our postage meter business were down less than 1% due to higher ink sales
in the U.K. and a slowing decline in worldwide meter population trends. Cost of supplies as a percentage of revenue increased to 31.5%
compared to 30.9% in the prior year primarily due to lower relative margins on supplies for production print equipment.
Supplies revenue decreased 8% to $283 million in 2012 compared to 2011 primarily due to reduced mail volumes, fewer installed meters
worldwide and lower ink and toner sales. Foreign currency translation had a 2% unfavorable impact on revenue. Cost of supplies as a
percentage of revenue was 30.9% compared with 31.6% in the prior year primarily due to a favorable mix of higher margin core supplies
sales.
0