Pitney Bowes 2013 Annual Report Download - page 103
Download and view the complete annual report
Please find page 103 of the 2013 Pitney Bowes annual report below. You can navigate through the pages in the report by either clicking on the pages listed below, or by using the keyword search tool below to find specific information within the annual report.-
 1
1 -
2
-
3
-
4
-
5
-
6
-
7
-
8
-
9
-
10
-
11
-
12
-
13
-
14
-
15
-
16
-
17
-
18
-
19
-
20
-
21
-
22
-
23
-
24
-
25
-
26
-
27
-
28
-
29
-
30
-
31
-
32
-
33
-
34
-
35
-
36
-
37
-
38
-
39
-
40
-
41
-
42
-
43
-
44
-
45
-
46
-
47
-
48
-
49
-
50
-
51
-
52
-
53
-
54
-
55
-
56
-
57
-
58
-
59
-
60
-
61
-
62
-
63
-
64
-
65
-
66
-
67
-
68
-
69
-
70
-
71
-
72
-
73
-
74
-
75
-
76
-
77
-
78
-
79
-
80
-
81
-
82
-
83
-
84
-
85
-
86
-
87
-
88
-
89
-
90
-
91
-
92
-
 93
93 -
 94
94 -
 95
95 -
 96
96 -
 97
97 -
 98
98 -
 99
99 -
 100
100 -
 101
101 -
 102
102 -
 103
103 -
 104
104 -
 105
105 -
 106
106 -
 107
107 -
 108
108 -
 109
109 -
 110
110 -
 111
111 -
 112
112 -
 113
113 -
114
-
115
-
116
 |
 |

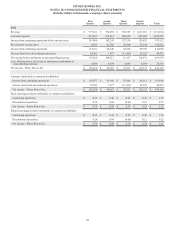
PITNEY BOWES INC.
NOTES TO CONSOLIDATED FINANCIAL STATEMENTS
(Tabular dollars in thousands, except per share amounts)
92
First
Quarter
Second
Quarter
Third
Quarter
Fourth
Quarter Total
2012
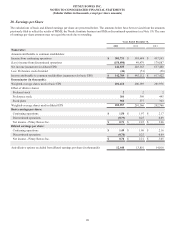
Revenue $ 975,101 $ 974,658 $ 949,789 $ 1,015,516 $ 3,915,064
Cost and expenses 832,017 832,413 826,659 889,663 3,380,752
Income from continuing operations before income taxes 143,084 142,245 123,130 125,853 534,312
Provision for income taxes 8,813 45,705 30,590 35,144 120,252
Income from continuing operations 134,271 96,540 92,540 90,709 414,060
Income (loss) from discontinued operations 28,993 7,677 (11,413) 24,222 49,479
Net income before attribution of noncontrolling interests 163,264 104,217 81,127 114,931 463,539
Less: Preferred stock dividends of subsidiaries attributable to
noncontrolling interests 4,594 4,594 4,594 4,594 18,376
Net income - Pitney Bowes Inc. $ 158,670 $ 99,623 $ 76,533 $ 110,337 $ 445,163
Amounts attributable to common stockholders:
Income from continuing operations $ 129,677 $ 91,946 $ 87,946 $ 86,115 $ 395,684
Income (loss) from discontinued operations 28,993 7,677 (11,413) 24,222 49,479
Net income - Pitney Bowes Inc. $ 158,670 $ 99,623 $ 76,533 $ 110,337 $ 445,163
Basic earnings per share attributable to common stockholders:
Continuing operations $ 0.65 $ 0.46 $ 0.44 $ 0.43 $ 1.97
Discontinued operations 0.14 0.04 (0.06) 0.12 0.25
Net income - Pitney Bowes Inc. $ 0.79 $ 0.50 $ 0.38 $ 0.55 $ 2.22
Diluted earnings per share attributable to common stockholders:
Continuing operations $ 0.65 $ 0.46 $ 0.44 $ 0.43 $ 1.96
Discontinued operations 0.14 0.04 (0.06) 0.12 0.25
Net income - Pitney Bowes Inc. $ 0.79 $ 0.50 $ 0.38 $ 0.55 $ 2.21