Pitney Bowes 2013 Annual Report Download - page 34
Download and view the complete annual report
Please find page 34 of the 2013 Pitney Bowes annual report below. You can navigate through the pages in the report by either clicking on the pages listed below, or by using the keyword search tool below to find specific information within the annual report.-
 1
1 -
2
-
3
-
4
-
5
-
6
-
7
-
8
-
9
-
10
-
11
-
12
-
13
-
14
-
15
-
16
-
17
-
18
-
19
-
20
-
21
-
22
-
23
-
 24
24 -
 25
25 -
 26
26 -
 27
27 -
 28
28 -
 29
29 -
 30
30 -
 31
31 -
 32
32 -
 33
33 -
 34
34 -
 35
35 -
 36
36 -
 37
37 -
 38
38 -
 39
39 -
 40
40 -
 41
41 -
 42
42 -
 43
43 -
 44
44 -
45
-
46
-
47
-
48
-
49
-
50
-
51
-
52
-
53
-
54
-
55
-
56
-
57
-
58
-
59
-
60
-
61
-
62
-
63
-
64
-
65
-
66
-
67
-
68
-
69
-
70
-
71
-
72
-
73
-
74
-
75
-
76
-
77
-
78
-
79
-
80
-
81
-
82
-
83
-
84
-
85
-
86
-
87
-
88
-
89
-
90
-
91
-
92
-
93
-
94
-
95
-
96
-
97
-
98
-
99
-
100
-
101
-
102
-
103
-
104
-
105
-
106
-
107
-
108
-
109
-
110
-
111
-
112
-
113
-
114
-
115
-
116
 |
 |

23
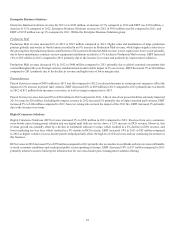
LIQUIDITY AND CAPITAL RESOURCES
We believe that existing cash and investments, cash generated from operations and borrowing capacity under our commercial paper
program are currently sufficient to support our cash needs, including discretionary uses such as capital investments, dividends and share
repurchases. Cash and cash equivalents and short-term investments were $939 million at December 31, 2013 and $950 million at
December 31, 2012. We continuously review our credit profile through published credit ratings and the credit default swap market. We
also monitor the creditworthiness of those banks acting as derivative counterparties, depository banks or credit providers.
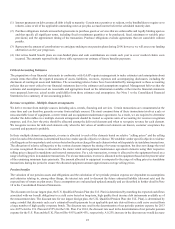
Cash Flow Summary
The change in cash and cash equivalents is as follows:
Year Ended December 31, Change
2013 2012 2011 2013 2012
Net cash provided by operating activities $ 625 $ 660 $ 949 $(35)$ (289)
Net cash provided by (used in) investing activities 251 (87)(117)338 30
Net cash used in financing activities (868)(519)(455)(349)(64)
Effect of exchange rate changes on cash and cash equivalents (13)3(5)(16)8
Change in cash and cash equivalents $(5)$ 57 $ 372 $(62)$ (315)
Net cash provided by operating activities was $625 million in 2013 compared to $660 million in 2012. The decrease in cash flow from
operations was due to lower income and cash payments related to debt extinguishments. These decreases were partially offset by lower
pension contributions, restructuring payments and increased cash from working capital management.
Net cash provided by operating activities was $660 million in 2012 compared to $949 million in 2011. The decrease in cash provided by
operations was primarily due to higher tax payments in 2012 resulting from the sale of leveraged lease assets, the loss of bonus depreciation
and higher income tax refunds received in 2011. The cash impact of finance and accounts receivables was also $105 million lower in
2012 compared to 2011.
Net cash provided by investing activities was $251 million in 2013 compared to net cash used of $87 million in 2012. The improvement
was mainly due to net proceeds of $390 million from the sale of businesses during 2013 and lower capital expenditures, partially offset
by lower deposits at the Bank. Cash flow in 2012 included proceeds of $106 million from the sale of leveraged lease assets.
Net cash used in investing activities was $87 million in 2012 compared to $117 million in 2011. The decrease in cash used in 2012 was
due to lower net purchases of investment securities partially offset by higher capital expenditures and lower growth in customer deposits.
Net cash used in financing activities was $868 million in 2013 compared to $519 million in 2012. The increase in cash used was due to
higher net repayments of debt partially offset by lower dividend payments. During the year, we paid $1,079 million to redeem long-term
debt and received $412 million from the issuance of new debt. In 2012, we paid $550 million to redeem long-term debt and received
$340 million from the issuance of new debt. Dividend payments were $112 million lower in 2013 compared to 2012. See Dividends
below.
Net cash used in financing activities was $519 million in 2012 compared to $455 million in 2011. The increase in cash used was due to
higher net repayments of debt partially offset by lower share repurchases.
Dividends
We paid dividends to our common stockholders of $189 million ($0.94 per share), $301 million ($1.50 per share) and $300 million ($1.48
per share) in 2013, 2012 and 2011, respectively. Each quarter, our Board of Directors will continue to consider our recent and projected
earnings and other capital needs and priorities in deciding whether to approve the payment, as well as the amount of a dividend. There
are no material restrictions on our ability to declare dividends.
Financings and Capitalization
We are a Well-Known Seasoned Issuer with the SEC, which allows us to issue debt securities, preferred stock, preference stock, common
stock, purchase contracts, depositary shares, warrants and units in an expedited fashion. We have a commercial paper program that is an
important source of liquidity for us and a committed credit facility of $1.0 billion to support our commercial paper issuances. The credit
facility expires in April 2016. We have not drawn upon the credit facility.