Pitney Bowes 2013 Annual Report Download - page 74
Download and view the complete annual report
Please find page 74 of the 2013 Pitney Bowes annual report below. You can navigate through the pages in the report by either clicking on the pages listed below, or by using the keyword search tool below to find specific information within the annual report.-
 1
1 -
2
-
3
-
4
-
5
-
6
-
7
-
8
-
9
-
10
-
11
-
12
-
13
-
14
-
15
-
16
-
17
-
18
-
19
-
20
-
21
-
22
-
23
-
24
-
25
-
26
-
27
-
28
-
29
-
30
-
31
-
32
-
33
-
34
-
35
-
36
-
37
-
38
-
39
-
40
-
41
-
42
-
43
-
44
-
45
-
46
-
47
-
48
-
49
-
50
-
51
-
52
-
53
-
54
-
55
-
56
-
57
-
58
-
59
-
60
-
61
-
62
-
63
-
 64
64 -
 65
65 -
 66
66 -
 67
67 -
 68
68 -
 69
69 -
 70
70 -
 71
71 -
 72
72 -
 73
73 -
 74
74 -
 75
75 -
 76
76 -
 77
77 -
 78
78 -
 79
79 -
 80
80 -
 81
81 -
 82
82 -
 83
83 -
 84
84 -
85
-
86
-
87
-
88
-
89
-
90
-
91
-
92
-
93
-
94
-
95
-
96
-
97
-
98
-
99
-
100
-
101
-
102
-
103
-
104
-
105
-
106
-
107
-
108
-
109
-
110
-
111
-
112
-
113
-
114
-
115
-
116
 |
 |

PITNEY BOWES INC.
NOTES TO CONSOLIDATED FINANCIAL STATEMENTS
(Tabular dollars in thousands, except per share amounts)
63
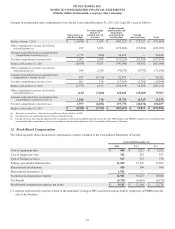
Changes in accumulated other comprehensive loss for the years ended December 31, 2013, 2012 and 2011 were as follows:
Gains (losses) on
cash flow hedges
Unrealized gains
(losses) on
available for sale
securities
Defined benefit
pension plans and
nonpension
postretirement
benefit plans
Foreign
currency items Total
Balance January 1, 2011 $(10,445) $ 1,439 $ (602,321) $ 137,521 $ (473,806)
Other comprehensive income (loss) before
reclassifications (a) 229 3,054 (173,699)(53,569) (223,985)
Amounts reclassified from accumulated other
comprehensive income (a), (b) 1,778 (106) 34,474 — 36,146
Net other comprehensive income (loss) 2,007 2,948 (139,225)(53,569) (187,839)
Balance at December 31, 2011 (8,438) 4,387 (741,546) 83,952 (661,645)
Other comprehensive income (loss) before
reclassifications (a) 104 1,240 (70,232)(2,702) (71,590)
Amounts reclassified from accumulated other
comprehensive income (a), (b) 557 (1,114) 52,579 — 52,022
Net other comprehensive income (loss) 661 126 (17,653)(2,702) (19,568)
Balance at December 31, 2012 (7,777) 4,513 (759,199) 81,250 (681,213)
Other comprehensive income (loss) before
reclassifications (a) (147)(7,000) 122,023 (39,489) 75,387
Amounts reclassified from accumulated other
comprehensive income (a), (b), (c) 1,544 718 35,755 (6,747) 31,270
Net other comprehensive income (loss) 1,397 (6,282) 157,778 (46,236) 106,657
Balance at December 31, 2013 $(6,380)$ (1,769)$ (601,421) $ 35,014 $ (574,556)
(a) Amounts are net of tax. Amounts in parentheses indicate debits to AOCI.
(b) See table above for additional details of these reclassifications.
(c) Foreign currency item amount represents the recognition of deferred translation upon the sale of the U.K. IMS business and PBMSi. Amount was reclassified from
accumulated other comprehensive loss and recorded as discontinued operations in the Consolidated Statements of Income.
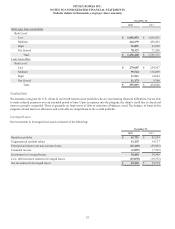
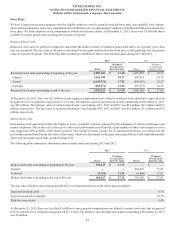
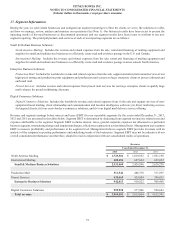
12. Stock-Based Compensation
The following table shows stock-based compensation expense included in the Consolidated Statements of Income:
Years Ended December 31,
2013 2012 2011
Cost of equipment sales $ 886 $ 1,212 $ 1,292
Cost of support services 382 522 557
Cost of business services 527 721 770
Selling, general and administrative 11,099 15,176 15,689
Research and development 435 596 640
Discontinued operations (1) 1,592 ——
Stock-based compensation expense 14,921 18,227 18,948
Tax benefit (5,759)(6,061) (6,170)
Stock-based compensation expense, net of tax $ 9,162 $ 12,166 $ 12,778
(1) Amount represents the expense related to the immediate vesting of RSUs and stock options held by employees of PBMS upon the
sale of the business.