Pitney Bowes 2013 Annual Report Download - page 49
Download and view the complete annual report
Please find page 49 of the 2013 Pitney Bowes annual report below. You can navigate through the pages in the report by either clicking on the pages listed below, or by using the keyword search tool below to find specific information within the annual report.-
 1
1 -
2
-
3
-
4
-
5
-
6
-
7
-
8
-
9
-
10
-
11
-
12
-
13
-
14
-
15
-
16
-
17
-
18
-
19
-
20
-
21
-
22
-
23
-
24
-
25
-
26
-
27
-
28
-
29
-
30
-
31
-
32
-
33
-
34
-
35
-
36
-
37
-
38
-
 39
39 -
 40
40 -
 41
41 -
 42
42 -
 43
43 -
 44
44 -
 45
45 -
 46
46 -
 47
47 -
 48
48 -
 49
49 -
 50
50 -
 51
51 -
 52
52 -
 53
53 -
 54
54 -
 55
55 -
 56
56 -
 57
57 -
 58
58 -
 59
59 -
60
-
61
-
62
-
63
-
64
-
65
-
66
-
67
-
68
-
69
-
70
-
71
-
72
-
73
-
74
-
75
-
76
-
77
-
78
-
79
-
80
-
81
-
82
-
83
-
84
-
85
-
86
-
87
-
88
-
89
-
90
-
91
-
92
-
93
-
94
-
95
-
96
-
97
-
98
-
99
-
100
-
101
-
102
-
103
-
104
-
105
-
106
-
107
-
108
-
109
-
110
-
111
-
112
-
113
-
114
-
115
-
116
 |
 |

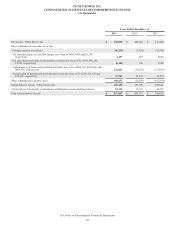
PITNEY BOWES INC.
CONSOLIDATED STATEMENTS OF INCOME
(In thousands, except per share amounts)
38
Years Ended December 31,
2013 2012 2011
Revenue:
Equipment sales $ 889,101 $ 870,537 $ 938,297
Supplies 289,808 283,459 307,762
Software 398,664 412,762 426,606
Rentals 522,008 551,607 601,517
Financing 460,786 495,130 547,269
Support services 677,742 707,582 723,945
Business services 631,292 593,987 579,945
Total revenue 3,869,401 3,915,064 4,125,341
Costs and expenses:
Cost of equipment sales 439,205 402,056 414,280
Cost of supplies 91,155 87,564 97,371
Cost of software 110,653 115,388 118,701
Cost of rentals 105,463 115,356 138,600
Financing interest expense 81,096 81,140 87,698
Cost of support services 419,656 440,039 452,579
Cost of business services 449,932 396,295 399,754
Selling, general and administrative 1,432,401 1,503,104 1,587,437
Research and development 110,412 114,250 129,155
Restructuring charges and asset impairments, net 84,344 17,176 118,630
Other interest expense 114,740 115,228 115,363
Interest income (5,472) (7,982) (5,795)
Other expense (income), net 32,639 1,138 (19,918)
Total costs and expenses 3,466,224 3,380,752 3,633,855
Income from continuing operations before income taxes 403,177 534,312 491,486
Provision for income taxes 83,069 120,252 35,518
Income from continuing operations 320,108 414,060 455,968
(Loss) income from discontinued operations, net of tax (158,898) 49,479 179,887
Net income before attribution of noncontrolling interests 161,210 463,539 635,855
Less: Preferred stock dividends of subsidiaries attributable to noncontrolling interests 18,375 18,376 18,375
Net income - Pitney Bowes Inc. $ 142,835 $ 445,163 $ 617,480
Amounts attributable to common stockholders:
Net income from continuing operations $ 301,733 $ 395,684 $ 437,593
(Loss) income from discontinued operations, net of tax (158,898) 49,479 179,887
Net income - Pitney Bowes Inc. $ 142,835 $ 445,163 $ 617,480
Basic earnings per share attributable to common stockholders (1):
Continuing operations $ 1.50 $ 1.97 $ 2.17
Discontinued operations (0.79) 0.25 0.89
Net income - Pitney Bowes Inc. $ 0.71 $ 2.22 $ 3.06
Diluted earnings per share attributable to common stockholders (1):
Continuing operations $ 1.49 $ 1.96 $ 2.16
Discontinued operations (0.78) 0.25 0.89
Net income - Pitney Bowes Inc. $ 0.70 $ 2.21 $ 3.05
(1) The sum of the earnings per share amounts may not equal the totals due to rounding.
See Notes to Consolidated Financial Statements