Pitney Bowes 2013 Annual Report Download - page 23
Download and view the complete annual report
Please find page 23 of the 2013 Pitney Bowes annual report below. You can navigate through the pages in the report by either clicking on the pages listed below, or by using the keyword search tool below to find specific information within the annual report.-
 1
1 -
2
-
3
-
4
-
5
-
6
-
7
-
8
-
9
-
10
-
11
-
12
-
 13
13 -
 14
14 -
 15
15 -
 16
16 -
 17
17 -
 18
18 -
 19
19 -
 20
20 -
 21
21 -
 22
22 -
 23
23 -
 24
24 -
 25
25 -
 26
26 -
 27
27 -
 28
28 -
 29
29 -
 30
30 -
 31
31 -
 32
32 -
 33
33 -
34
-
35
-
36
-
37
-
38
-
39
-
40
-
41
-
42
-
43
-
44
-
45
-
46
-
47
-
48
-
49
-
50
-
51
-
52
-
53
-
54
-
55
-
56
-
57
-
58
-
59
-
60
-
61
-
62
-
63
-
64
-
65
-
66
-
67
-
68
-
69
-
70
-
71
-
72
-
73
-
74
-
75
-
76
-
77
-
78
-
79
-
80
-
81
-
82
-
83
-
84
-
85
-
86
-
87
-
88
-
89
-
90
-
91
-
92
-
93
-
94
-
95
-
96
-
97
-
98
-
99
-
100
-
101
-
102
-
103
-
104
-
105
-
106
-
107
-
108
-
109
-
110
-
111
-
112
-
113
-
114
-
115
-
116
 |
 |
PART II
12
ITEM 5. MARKET FOR THE COMPANY'S COMMON EQUITY, RELATED STOCKHOLDER MATTERS AND ISSUER
PURCHASES OF EQUITY SECURITIES
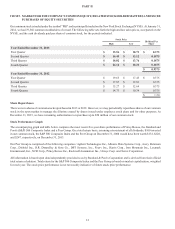
Our common stock is traded under the symbol "PBI" and is principally traded on the New York Stock Exchange (NYSE). At January 31,
2014, we had 19,566 common stockholders of record. The following table sets forth the high and low sales prices, as reported on the
NYSE, and the cash dividends paid per share of common stock, for the periods indicated.
Stock Price Dividend Per
ShareHigh Low
Year Ended December 31, 2013
First Quarter $ 15.56 $ 10.71 $ 0.375
Second Quarter $ 16.43 $ 13.12 0.1875
Third Quarter $ 18.82 $ 13.76 0.1875
Fourth Quarter $ 24.18 $ 18.21 0.1875
$ 0.9375
Year Ended December 31, 2012
First Quarter $ 19.65 $ 17.45 $ 0.375
Second Quarter $ 17.87 $ 12.81 0.375
Third Quarter $ 15.27 $ 12.64 0.375
Fourth Quarter $ 14.73 $ 10.34 0.375
$ 1.50
Share Repurchases
There were no shares of common stock repurchased in 2013 or 2012. However, we may periodically repurchase shares of our common
stock in the open market to manage the dilution created by shares issued under employee stock plans and for other purposes. At
December 31, 2013, we have remaining authorization to repurchase up to $50 million of our common stock.
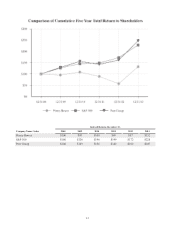
Stock Performance Graph
The accompanying graph and table below compares the most recent five-year share performance of Pitney Bowes, the Standard and
Poor's (S&P) 500 Composite Index and a Peer Group. On a total return basis, assuming reinvestment of all dividends, $100 invested
in our common stock, the S&P 500 Composite Index and the Peer Group on December 31, 2008 would have been worth $132, $228,
and $247, respectively, on December 31, 2013.
Our Peer Group is comprised of the following companies: Agilent Technologies Inc., Alliance Data Systems Corp., Avery Dennison
Corp., Diebold Inc., R.R. Donnelley & Sons Co., DST Systems, Inc., Fiserv Inc., Harris Corp., Iron Mountain Inc., Lexmark
International, Inc., NCR Corp., Pitney Bowes Inc., Rockwell Automation Inc., Unisys Corp. and Xerox Corporation.
All information is based upon data independently provided to us by Standard & Poor's Corporation and is derived from their official
total return calculation. Total return for the S&P 500 Composite Index and the Peer Group is based on market capitalization, weighted
for each year. The stock price performance is not necessarily indicative of future stock price performance.