Pitney Bowes 2013 Annual Report Download - page 61
Download and view the complete annual report
Please find page 61 of the 2013 Pitney Bowes annual report below. You can navigate through the pages in the report by either clicking on the pages listed below, or by using the keyword search tool below to find specific information within the annual report.-
 1
1 -
2
-
3
-
4
-
5
-
6
-
7
-
8
-
9
-
10
-
11
-
12
-
13
-
14
-
15
-
16
-
17
-
18
-
19
-
20
-
21
-
22
-
23
-
24
-
25
-
26
-
27
-
28
-
29
-
30
-
31
-
32
-
33
-
34
-
35
-
36
-
37
-
38
-
39
-
40
-
41
-
42
-
43
-
44
-
45
-
46
-
47
-
48
-
49
-
50
-
 51
51 -
 52
52 -
 53
53 -
 54
54 -
 55
55 -
 56
56 -
 57
57 -
 58
58 -
 59
59 -
 60
60 -
 61
61 -
 62
62 -
 63
63 -
 64
64 -
 65
65 -
 66
66 -
 67
67 -
 68
68 -
 69
69 -
 70
70 -
 71
71 -
72
-
73
-
74
-
75
-
76
-
77
-
78
-
79
-
80
-
81
-
82
-
83
-
84
-
85
-
86
-
87
-
88
-
89
-
90
-
91
-
92
-
93
-
94
-
95
-
96
-
97
-
98
-
99
-
100
-
101
-
102
-
103
-
104
-
105
-
106
-
107
-
108
-
109
-
110
-
111
-
112
-
113
-
114
-
115
-
116
 |
 |

PITNEY BOWES INC.
NOTES TO CONSOLIDATED FINANCIAL STATEMENTS
(Tabular dollars in thousands, except per share amounts)
50
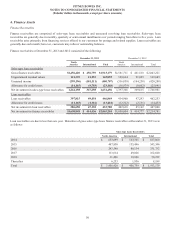
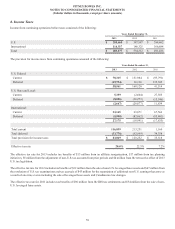
4. Finance Assets
Finance Receivables
Finance receivables are comprised of sales-type lease receivables and unsecured revolving loan receivables. Sales-type lease
receivables are generally due in monthly, quarterly or semi-annual installments over periods ranging from three to five years. Loan
receivables arise primarily from financing services offered to our customers for postage and related supplies. Loan receivables are
generally due each month; however, customers may rollover outstanding balances.
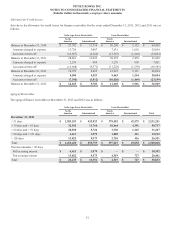
Finance receivables at December 31, 2013 and 2012 consisted of the following:
December 31, 2013 December 31, 2012
North
America International Total
North
America International Total
Sales-type lease receivables
Gross finance receivables $1,456,420 $ 456,759 $1,913,179 $1,581,711 $ 461,510 $2,043,221
Unguaranteed residual values 121,339 21,553 142,892 148,664 21,025 169,689
Unearned income (299,396) (101,311)(400,707)(316,030)(104,258) (420,288)
Allowance for credit losses (14,165) (9,703)(23,868)(16,979)(8,662) (25,641)
Net investment in sales-type lease receivables 1,264,198 367,298 1,631,496 1,397,366 369,615 1,766,981
Loan receivables
Loan receivables 397,815 49,054 446,869 414,960 47,293 462,253
Allowance for credit losses (11,165) (1,916)(13,081)(12,322)(2,131) (14,453)
Net investment in loan receivables 386,650 47,138 433,788 402,638 45,162 447,800
Net investment in finance receivables $1,650,848 $ 414,436 $2,065,284 $1,800,004 $ 414,777 $2,214,781
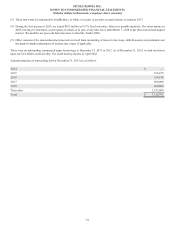
Loan receivables are due in less than one year. Maturities of gross sales-type lease finance receivables at December 31, 2013 were
as follows:
Sales-type Lease Receivables
North America International Total
2014 $ 653,699 $ 163,361 $ 817,060
2015 407,850 135,496 543,346
2016 243,598 88,134 331,732
2017 113,614 49,026 162,640
2018 31,406 18,806 50,212
Thereafter 6,253 1,936 8,189
Total $ 1,456,420 $ 456,759 $ 1,913,179