Pitney Bowes 2013 Annual Report Download - page 77
Download and view the complete annual report
Please find page 77 of the 2013 Pitney Bowes annual report below. You can navigate through the pages in the report by either clicking on the pages listed below, or by using the keyword search tool below to find specific information within the annual report.-
 1
1 -
2
-
3
-
4
-
5
-
6
-
7
-
8
-
9
-
10
-
11
-
12
-
13
-
14
-
15
-
16
-
17
-
18
-
19
-
20
-
21
-
22
-
23
-
24
-
25
-
26
-
27
-
28
-
29
-
30
-
31
-
32
-
33
-
34
-
35
-
36
-
37
-
38
-
39
-
40
-
41
-
42
-
43
-
44
-
45
-
46
-
47
-
48
-
49
-
50
-
51
-
52
-
53
-
54
-
55
-
56
-
57
-
58
-
59
-
60
-
61
-
62
-
63
-
64
-
65
-
66
-
 67
67 -
 68
68 -
 69
69 -
 70
70 -
 71
71 -
 72
72 -
 73
73 -
 74
74 -
 75
75 -
 76
76 -
 77
77 -
 78
78 -
 79
79 -
 80
80 -
 81
81 -
 82
82 -
 83
83 -
 84
84 -
 85
85 -
 86
86 -
 87
87 -
88
-
89
-
90
-
91
-
92
-
93
-
94
-
95
-
96
-
97
-
98
-
99
-
100
-
101
-
102
-
103
-
104
-
105
-
106
-
107
-
108
-
109
-
110
-
111
-
112
-
113
-
114
-
115
-
116
 |
 |

PITNEY BOWES INC.
NOTES TO CONSOLIDATED FINANCIAL STATEMENTS
(Tabular dollars in thousands, except per share amounts)
66
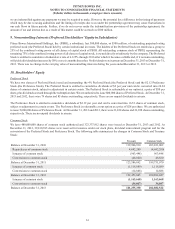
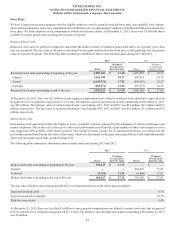
Employee Stock Purchase Plan
We maintain a non-compensatory Employee Stock Purchase Plan that enables substantially all U.S. and Canadian employees to purchase
shares of our common stock at an offering price of 95% of the average market price on the offering date. At no time will the exercise
price be less than the lowest price permitted under Section 423 of the Internal Revenue Code. Employees purchased 222,159 shares and
291,859 shares in 2013 and 2012, respectively. We have reserved 4,594,776 common shares for future purchase under the ESPP.
Directors' Stock Plan
Each non-employee director is granted shares of restricted stock on an annual basis. In 2013 and 2012, we granted 19,800 shares and
26,653 shares to non-employee directors, respectively.
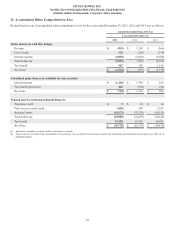
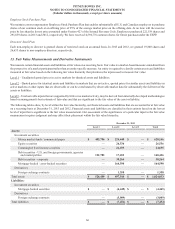
13. Fair Value Measurements and Derivative Instruments
We measure certain financial assets and liabilities at fair value on a recurring basis. Fair value is a market-based measure considered from
the perspective of a market participant rather than an entity-specific measure. An entity is required to classify certain assets and liabilities
measured at fair value based on the following fair value hierarchy that prioritizes the inputs used to measure fair value:
Level 1 – Unadjusted quoted prices in active markets for identical assets and liabilities.
Level 2 – Quoted prices for identical assets and liabilities in markets that are not active, quoted prices for similar assets and liabilities in
active markets or other inputs that are observable or can be corroborated by observable market data for substantially the full term of the
assets or liabilities.
Level 3 – Unobservable inputs that are supported by little or no market activity, may be derived from internally developed methodologies
based on management's best estimate of fair value and that are significant to the fair value of the asset or liability.
The following tables show, by level within the fair value hierarchy, our financial assets and liabilities that are accounted for at fair value
on a recurring basis at December 31, 2013 and 2012. Financial assets and liabilities are classified in their entirety based on the lowest
level of input that is significant to the fair value measurement. Our assessment of the significance of a particular input to the fair value
measurement requires judgment and may affect their placement within the fair value hierarchy.
December 31, 2013
Level 1 Level 2 Level 3 Total
Assets:
Investment securities
Money market funds / commercial paper $ 403,706 $ 224,440 $ — $ 628,146
Equity securities — 26,536 — 26,536
Commingled fixed income securities — 24,695 — 24,695
Debt securities - U.S. and foreign governments, agencies
and municipalities 122,783 17,653 — 140,436
Debt securities - corporate — 38,264 — 38,264
Mortgage-backed / asset-backed securities — 164,598 — 164,598
Derivatives
Foreign exchange contracts — 1,358 — 1,358
Total assets $ 526,489 $ 497,544 $ — $ 1,024,033
Liabilities:
Investment securities
Mortgage-backed securities $—$
(4,445) $ — $ (4,445)
Derivatives
Foreign exchange contracts —(3,009) — (3,009)
Total liabilities $—$
(7,454) $ — $ (7,454)