Pitney Bowes 2011 Annual Report Download - page 99
Download and view the complete annual report
Please find page 99 of the 2011 Pitney Bowes annual report below. You can navigate through the pages in the report by either clicking on the pages listed below, or by using the keyword search tool below to find specific information within the annual report.-
 1
1 -
2
-
3
-
4
-
5
-
6
-
7
-
8
-
9
-
10
-
11
-
12
-
13
-
14
-
15
-
16
-
17
-
18
-
19
-
20
-
21
-
22
-
23
-
24
-
25
-
26
-
27
-
28
-
29
-
30
-
31
-
32
-
33
-
34
-
35
-
36
-
37
-
38
-
39
-
40
-
41
-
42
-
43
-
44
-
45
-
46
-
47
-
48
-
49
-
50
-
51
-
52
-
53
-
54
-
55
-
56
-
57
-
58
-
59
-
60
-
61
-
62
-
63
-
64
-
65
-
66
-
67
-
68
-
69
-
70
-
71
-
72
-
73
-
74
-
75
-
76
-
77
-
78
-
79
-
80
-
81
-
82
-
83
-
84
-
85
-
86
-
87
-
88
-
 89
89 -
 90
90 -
 91
91 -
 92
92 -
 93
93 -
 94
94 -
 95
95 -
 96
96 -
 97
97 -
 98
98 -
 99
99 -
 100
100 -
 101
101 -
 102
102 -
 103
103 -
 104
104 -
 105
105 -
 106
106 -
 107
107 -
 108
108 -
 109
109 -
110
-
111
-
112
-
113
-
114
-
115
-
116
-
117
-
118
-
119
-
120
 |
 |

PITNEY BOWES INC.
NOTES TO CONSOLIDATED FINANCIAL STATEMENTS
(Tabular dollars in thousands, except per share data)
81
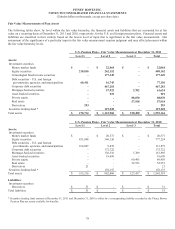
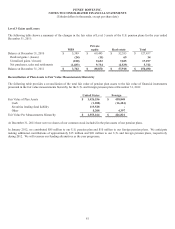
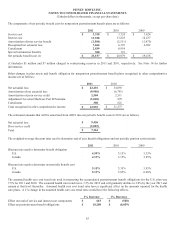
Level 3 Gains and Losses
The following table shows a summary of the changes in the fair value of Level 3 assets of the U.S. pension plans for the year ended
December 31, 2011:
MBS Private
equity Real estate Total
Balance at December 31, 2010 $ 5,389 $ 69,495 $ 52,553 $ 127,437
Realized gains / (losses) (24) (11) 69 34
Unrealized gains / (losses) (180) 9,652 7,825 17,297
Net purchases, sales and settlements (1,483) 9,734 (2,529) 5,722
Balance at December 31, 2011 $ 3,702 $ 88,870 $ 57,918 $ 150,490
Reconciliation of Plan Assets to Fair Value Measurements Hierarchy
The following table provides a reconciliation of the total fair value of pension plan assets to the fair value of financial instruments
presented in the fair value measurements hierarchy for the U.S. and foreign pension plans at December 31, 2011:
United States Foreign
Fair Value of Plan Assets $ 1,426,536 $ 438,848
Cash (1,108) (16,424)
Securities lending fund liability 119,528 -
Other 8,208 4,397
Fair Value Per Measurements Hierarchy $ 1,553,164 $ 426,821
At December 31, 2011 there were no shares of our common stock included in the plan assets of our pension plans.
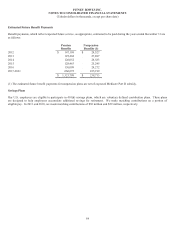
In January 2012, we contributed $85 million to our U.S. pension plan and $10 million to our foreign pension plans. We anticipate
making additional contributions of approximately $15 million and $20 million to our U.S. and foreign pension plans, respectively
during 2012. We will reassess our funding alternatives as the year progresses.