Pitney Bowes 2011 Annual Report Download - page 70
Download and view the complete annual report
Please find page 70 of the 2011 Pitney Bowes annual report below. You can navigate through the pages in the report by either clicking on the pages listed below, or by using the keyword search tool below to find specific information within the annual report.-
 1
1 -
2
-
3
-
4
-
5
-
6
-
7
-
8
-
9
-
10
-
11
-
12
-
13
-
14
-
15
-
16
-
17
-
18
-
19
-
20
-
21
-
22
-
23
-
24
-
25
-
26
-
27
-
28
-
29
-
30
-
31
-
32
-
33
-
34
-
35
-
36
-
37
-
38
-
39
-
40
-
41
-
42
-
43
-
44
-
45
-
46
-
47
-
48
-
49
-
50
-
51
-
52
-
53
-
54
-
55
-
56
-
57
-
58
-
59
-
 60
60 -
 61
61 -
 62
62 -
 63
63 -
 64
64 -
 65
65 -
 66
66 -
 67
67 -
 68
68 -
 69
69 -
 70
70 -
 71
71 -
 72
72 -
 73
73 -
 74
74 -
 75
75 -
 76
76 -
 77
77 -
 78
78 -
 79
79 -
 80
80 -
81
-
82
-
83
-
84
-
85
-
86
-
87
-
88
-
89
-
90
-
91
-
92
-
93
-
94
-
95
-
96
-
97
-
98
-
99
-
100
-
101
-
102
-
103
-
104
-
105
-
106
-
107
-
108
-
109
-
110
-
111
-
112
-
113
-
114
-
115
-
116
-
117
-
118
-
119
-
120
 |
 |

PITNEY BOWES INC.
NOTES TO CONSOLIDATED FINANCIAL STATEMENTS
(Tabular dollars in thousands, except per share data)
52
The effective rate for 2009 included a charge of $13 million for the write-off of deferred tax assets associated with the expiration of
out-of-the-money vested stock options and the vesting of restricted stock, offset by $13 million of tax benefits from retirement of
intercompany obligations and the repricing of leveraged lease transactions.
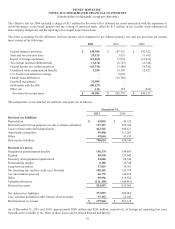
The items accounting for the difference between income taxes computed at the federal statutory rate and our provision for income
taxes consist of the following:
2011 2010 2009
Federal statutory provision $ 144,998 $ 187,103 $ 242,612
State and local income taxes 10,135 5,853 11,109
Impact of foreign operations (41,669) 13,938 (18,037)
Tax exempt income/reimbursement (2,674) (2,352) (2,748)
Federal income tax credits/incentives (10,741) (7,580) (4,792)
Unrealized stock compensation benefits 3,538 15,149 12,852
U.S. health care reform tax change - 9,070 -
Outside basis differences - (15,798) -
Goodwill impairment 31,095 - -
Settlements with the IRS (90,227) - -
Other, net 130 387 (842)
Provision for income taxes $ 44,585 $ 205,770 $ 240,154
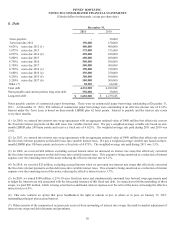
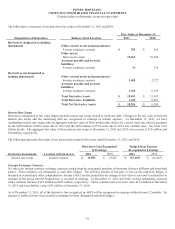
The components of our deferred tax liabilities and assets are as follows:
December 31,
2011 2010
Deferred tax liabilities:
Depreciation $ 69,092 $ 49,351
Deferred profit (for tax purposes) on sale to finance subsidiary 157,397 229,364
Lease revenue and related depreciation 422,541 480,611
Amortizable intangibles 99,980 117,207
Other 49,044 43,813
Deferred tax liabilities 798,054 920,346
Deferred tax assets:
Nonpension postretirement benefits 198,379 104,847
Pension 40,956 127,042
Inventory and equipment capitalization 24,806 28,546
Restructuring charges 8,185 22,348
Long-term incentives 37,019 39,781
Net operating loss and tax credit carry forwards 180,281 153,754
Tax uncertainties gross-up 46,773 144,672
Other 99,996 116,834
Valuation allowance (111,438) (104,441)
Deferred tax assets 524,957 633,383
Net deferred tax liabilities 273,097 286,963
Less: amounts included in other balance sheet accounts 97,153 25,845
Deferred taxes on income $ 175,944 $ 261,118
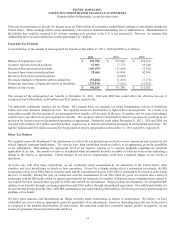
As of December 31, 2011 and 2010, approximately $286 million and $266 million, respectively, of foreign net operating loss carry
forwards were available to us. Most of these losses can be carried forward indefinitely.