Pitney Bowes 2011 Annual Report Download - page 69
Download and view the complete annual report
Please find page 69 of the 2011 Pitney Bowes annual report below. You can navigate through the pages in the report by either clicking on the pages listed below, or by using the keyword search tool below to find specific information within the annual report.-
 1
1 -
2
-
3
-
4
-
5
-
6
-
7
-
8
-
9
-
10
-
11
-
12
-
13
-
14
-
15
-
16
-
17
-
18
-
19
-
20
-
21
-
22
-
23
-
24
-
25
-
26
-
27
-
28
-
29
-
30
-
31
-
32
-
33
-
34
-
35
-
36
-
37
-
38
-
39
-
40
-
41
-
42
-
43
-
44
-
45
-
46
-
47
-
48
-
49
-
50
-
51
-
52
-
53
-
54
-
55
-
56
-
57
-
58
-
 59
59 -
 60
60 -
 61
61 -
 62
62 -
 63
63 -
 64
64 -
 65
65 -
 66
66 -
 67
67 -
 68
68 -
 69
69 -
 70
70 -
 71
71 -
 72
72 -
 73
73 -
 74
74 -
 75
75 -
 76
76 -
 77
77 -
 78
78 -
 79
79 -
80
-
81
-
82
-
83
-
84
-
85
-
86
-
87
-
88
-
89
-
90
-
91
-
92
-
93
-
94
-
95
-
96
-
97
-
98
-
99
-
100
-
101
-
102
-
103
-
104
-
105
-
106
-
107
-
108
-
109
-
110
-
111
-
112
-
113
-
114
-
115
-
116
-
117
-
118
-
119
-
120
 |
 |

PITNEY BOWES INC.
NOTES TO CONSOLIDATED FINANCIAL STATEMENTS
(Tabular dollars in thousands, except per share data)
51
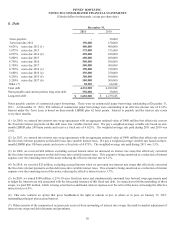
We have a committed line of credit of $1.25 billion to support commercial paper issuances. As of December 31, 2011, we had not
drawn upon the line of credit. Fees paid to maintain the line of credit were $1 million, $2 million and $1 million in 2011, 2010 and
2009, respectively.
Annual maturities of outstanding long-term debt at December 31, 2011 are as follows: 2012 – $550 million; 2013 – $375 million;
2014 – $450 million; 2015 – $400 million; 2016 – $500 million; and $1,900 million thereafter.
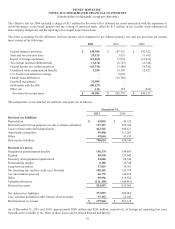
9. Income Taxes
The provision for income taxes from continuing operations consists of the following:
Years ended December 31,
2011 2010 2009
U.S. Federal:
Current $ (87,713) $ 170,175 $ 188,272
Deferred 135,305 (24,632) 18,979
47,592 145,543 207,251
U.S. State and Local:
Current 31,726 26,523 30,981
Deferred (15,546) (17,518) (13,067)
16,180 9,005 17,914
International:
Current 66,214 43,459 31,848
Deferred (85,401) 7,763 (16,859)
(19,187) 51,222 14,989
Total Current 10,227 240,157 251,101
Total Deferred 34,358 (34,387) (10,947)
Total provision for income taxes $ 44,585 $ 205,770 $ 240,154
The components of income from continuing operations are as follows:
Years ended December 31,
2011 2010 2009
U.S. $ 408,934 $ 390,911 $ 552,636
International 5,347 143,666 140,540
Total $ 414,281 $ 534,577 $ 693,176
The effective tax rate for continuing operations for 2011, 2010 and 2009 was 10.8%, 38.5% and 34.6%, respectively. The effective
tax rate for 2011 includes $90 million of tax benefits from the IRS tax settlements (see Other Matters below), a $34 million tax benefit
from the sale of non-U.S. leveraged lease assets and a $4 million charge from the write-off of deferred tax assets associated with the
expiration of out-of-the-money vested stock options and the vesting of restricted stock units previously granted to our employees. In
addition, the effective tax rate for 2011 was increased due to a reduced tax benefit associated with the goodwill impairment charges.
The effective tax rate for 2010 includes $16 million of tax benefits associated with previously unrecognized deferred taxes on outside
basis differences, a $15 million charge for the write-off of deferred tax assets associated with the expiration of out-of-the-money
vested stock options and the vesting of restricted stock units previously granted to our employees and a $9 million charge for the
write-off of deferred tax assets related to the U.S. health care reform legislation that eliminated the tax deduction for retiree health care
costs to the extent of federal subsidies received by companies that provide retiree prescription drug benefits equivalent to Medicare
Part D coverage.