Pitney Bowes 2011 Annual Report Download - page 95
Download and view the complete annual report
Please find page 95 of the 2011 Pitney Bowes annual report below. You can navigate through the pages in the report by either clicking on the pages listed below, or by using the keyword search tool below to find specific information within the annual report.-
 1
1 -
2
-
3
-
4
-
5
-
6
-
7
-
8
-
9
-
10
-
11
-
12
-
13
-
14
-
15
-
16
-
17
-
18
-
19
-
20
-
21
-
22
-
23
-
24
-
25
-
26
-
27
-
28
-
29
-
30
-
31
-
32
-
33
-
34
-
35
-
36
-
37
-
38
-
39
-
40
-
41
-
42
-
43
-
44
-
45
-
46
-
47
-
48
-
49
-
50
-
51
-
52
-
53
-
54
-
55
-
56
-
57
-
58
-
59
-
60
-
61
-
62
-
63
-
64
-
65
-
66
-
67
-
68
-
69
-
70
-
71
-
72
-
73
-
74
-
75
-
76
-
77
-
78
-
79
-
80
-
81
-
82
-
83
-
84
-
 85
85 -
 86
86 -
 87
87 -
 88
88 -
 89
89 -
 90
90 -
 91
91 -
 92
92 -
 93
93 -
 94
94 -
 95
95 -
 96
96 -
 97
97 -
 98
98 -
 99
99 -
 100
100 -
 101
101 -
 102
102 -
 103
103 -
 104
104 -
 105
105 -
106
-
107
-
108
-
109
-
110
-
111
-
112
-
113
-
114
-
115
-
116
-
117
-
118
-
119
-
120
 |
 |

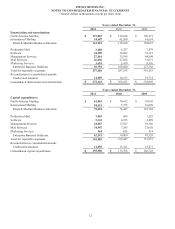
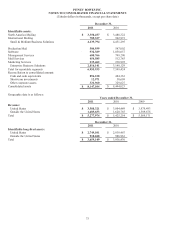
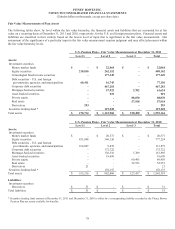
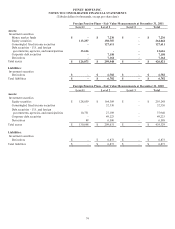
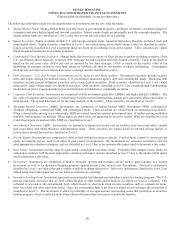
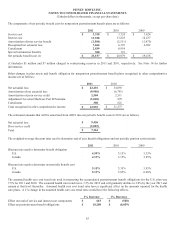
PITNEY BOWES INC.
NOTES TO CONSOLIDATED FINANCIAL STATEMENTS
(Tabular dollars in thousands, except per share data)
77
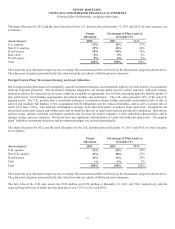
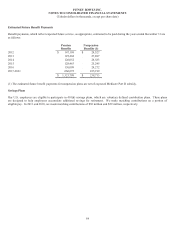
The target allocation for 2012 and the asset allocation for the U.S. pension plan at December 31, 2011 and 2010, by asset category, are
as follows:
Target
Allocation
Percentage of Plan Assets at
December 31,
Asset category 2012 2011 2010
U.S. equities 19% 18% 37%
Non-U.S. equities 19% 16% 20%
Fixed income 50% 56% 34%
Real estate 4% 4% 4%
Private equity 8% 6% 5%
Total 100% 100% 100%
The long-term asset allocation targets we use to manage the investment portfolio are based on the broad asset categories shown above.
The plan asset categories presented in the fair value hierarchy are subsets of the broad asset categories.
Foreign Pension Plans’ Investment Strategy and Asset Allocation
Our foreign pension plan assets are managed by outside investment managers and monitored regularly by local trustees, in conjunction
with our corporate personnel. The investment strategies adopted by our foreign plans vary by country and plan, with each strategy
tailored to achieve the expected rate of return within an acceptable or appropriate level of risk, depending upon the liability profile of
plan participants, local funding requirements, investment markets and restrictions. The U.K. plan represents 74% of the non-U.S.
pension assets. The U.K. pension plan’s investment strategy is to maximize returns within reasonable and prudent levels of risk, to
achieve and maintain full funding of the accumulated benefit obligations and the actuarial liabilities, and to earn a nominal rate of
return of at least 7.25%. The fund has established a strategic asset allocation policy to achieve these objectives. Investments are
diversified across asset classes and within each class to minimize the risk of large losses and are periodically rebalanced. Derivatives,
such as swaps, options, forwards and futures contracts may be used for market exposure, to alter risk/return characteristics and to
manage foreign currency exposure. We do not have any significant concentrations of credit risk within the plan assets. The pension
plans’ liabilities, investment objectives and investment managers are reviewed periodically.
The target allocation for 2012 and the asset allocation for the U.K. pension plan at December 31, 2011 and 2010, by asset category,
are as follows:
Target
Allocation
Percentage of Plan Assets at
December 31,
Asset category 2012 2011 2010
U.K. equities 32% 34% 33%
Non-U.K. equities 33% 28% 35%
Fixed income 35% 32% 29%
Cash -% 6% 3%
Total 100% 100% 100%
The long-term asset allocation targets we use to manage the investment portfolio are based on the broad asset categories shown above.
The plan asset categories presented in the fair value hierarchy are subsets of the broad asset categories.
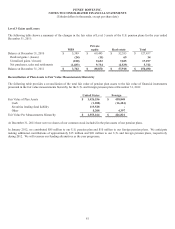
The fair value of the U.K. plan assets was $326 million and $338 million at December 31, 2011 and 2010, respectively, and the
expected long-term rate of return on these plan assets was 7.25% in 2011 and 2010.