Pitney Bowes 2011 Annual Report Download - page 37
Download and view the complete annual report
Please find page 37 of the 2011 Pitney Bowes annual report below. You can navigate through the pages in the report by either clicking on the pages listed below, or by using the keyword search tool below to find specific information within the annual report.-
 1
1 -
2
-
3
-
4
-
5
-
6
-
7
-
8
-
9
-
10
-
11
-
12
-
13
-
14
-
15
-
16
-
17
-
18
-
19
-
20
-
21
-
22
-
23
-
24
-
25
-
26
-
 27
27 -
 28
28 -
 29
29 -
 30
30 -
 31
31 -
 32
32 -
 33
33 -
 34
34 -
 35
35 -
 36
36 -
 37
37 -
 38
38 -
 39
39 -
 40
40 -
 41
41 -
 42
42 -
 43
43 -
 44
44 -
 45
45 -
 46
46 -
 47
47 -
48
-
49
-
50
-
51
-
52
-
53
-
54
-
55
-
56
-
57
-
58
-
59
-
60
-
61
-
62
-
63
-
64
-
65
-
66
-
67
-
68
-
69
-
70
-
71
-
72
-
73
-
74
-
75
-
76
-
77
-
78
-
79
-
80
-
81
-
82
-
83
-
84
-
85
-
86
-
87
-
88
-
89
-
90
-
91
-
92
-
93
-
94
-
95
-
96
-
97
-
98
-
99
-
100
-
101
-
102
-
103
-
104
-
105
-
106
-
107
-
108
-
109
-
110
-
111
-
112
-
113
-
114
-
115
-
116
-
117
-
118
-
119
-
120
 |
 |

19
Software
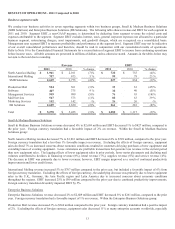
Software revenue increased 5% to $390 million compared to the prior year. The acquisition of Portrait accounted for 4% of the
increase and foreign currency translation accounted for 1% of the increase. Period revenue growth was also negatively impacted by
the shift to recurring revenue streams through multi-year licensing agreements. Cost of software as a percentage of revenue was
23.9% compared to 23.7% in the prior year.
Rentals
Rentals revenue decreased 7% to $601 million compared to the prior year as customers in the U.S. continue to downsize to smaller,
fully featured machines. The weak economic conditions have also impacted our international rental markets, specifically in France.
Foreign currency translation had less than a 1% positive impact. Cost of rentals as a percentage of revenue was 23.6% compared with
24.5% in the prior year. Rental margins have been positively impacted by lower depreciation associated with higher levels of lease
extensions.
Financing
Financing revenue decreased 8% to $638 million compared to the prior year as lower equipment sales in previous years have resulted
in a net decline in both our U.S. and international lease portfolios. Foreign currency translation had a 1% positive impact. Financing
interest expense as a percentage of revenue was 13.8% compared with 14.1% in the prior year due to lower interest rates and lower
average borrowings. In computing financing interest expense, we assume a 10:1 leveraging ratio of debt to equity and apply our
overall effective interest rate to the average outstanding finance receivables.
Support Services
Support services revenue of $712 million was flat compared to the prior year. Growth has been negatively impacted by lower
placements of mailing equipment, primarily in the U.S., U.K. and France. Foreign currency translation had a positive impact of 1%.
Cost of support services as a percentage of revenue improved to 63.5% compared with 65.4% in the prior year due to margin
improvements from our ongoing productivity investments in the U.S. and International Mailing and Production Mail businesses.
Business Services
Business services revenue decreased 3% to $1,744 million compared to the prior year primarily due to the loss of several large postal
contracts and print volumes at Management Services. Foreign currency translation had less than a 1% negative impact. Cost of
business services as a percentage of revenue was 76.7% compared with 76.6% in the prior year. Positive impacts of cost reduction
programs at our Management Services and Presort businesses were offset by higher shipping costs in International Mail Services.
Selling, general and administrative (SG&A)
SG&A expenses decreased $40 million, or 2% primarily as a result of our cost reduction initiatives. Businesses acquired in 2010
increased SG&A by $15 million and foreign currency translation had a less than 1% unfavorable impact. As a percentage of revenue,
SG&A expenses were 32.5% compared to 32.3% in the prior year.
Research and development
Research and development expenses decreased $26 million, or 14% from the prior year due to the wind-down of redundant costs
related to our transition to offshore development activities and the launch of the new Connect+TM mailing system. Foreign currency
translation had an unfavorable impact of 1%. As a percentage of revenue, research and development expenses were 2.9% compared to
3.3% in the prior year.
Income taxes / effective tax rate
The effective tax rates for 2010 and 2009 were 38.5% and 34.6%, respectively. The effective tax rate for 2010 included $16 million
of tax benefits associated with previously unrecognized deferred taxes on outside basis differences, a $15 million charge for the write-
off of deferred tax assets associated with the expiration of out-of-the-money vested stock options and the vesting of restricted stock
units previously granted to our employees and a $9 million charge for the write-off of deferred tax assets related to the U.S. health
care reform legislation that eliminated the tax deduction for retiree health care costs to the extent of federal subsidies received by
companies that provide retiree prescription drug benefits equivalent to Medicare Part D coverage.
The effective tax rate for 2009 included $13 million of tax charges related to the write-off of deferred tax assets associated with the
expiration of out-of-the-money vested stock options and the vesting of restricted stock, offset by $13 million of tax benefits from
retirement of intercompany obligations and the repricing of leveraged lease transactions.
Discontinued operations
See Note 2 to the Consolidated Financial Statements.