Pitney Bowes 2011 Annual Report Download - page 58
Download and view the complete annual report
Please find page 58 of the 2011 Pitney Bowes annual report below. You can navigate through the pages in the report by either clicking on the pages listed below, or by using the keyword search tool below to find specific information within the annual report.-
 1
1 -
2
-
3
-
4
-
5
-
6
-
7
-
8
-
9
-
10
-
11
-
12
-
13
-
14
-
15
-
16
-
17
-
18
-
19
-
20
-
21
-
22
-
23
-
24
-
25
-
26
-
27
-
28
-
29
-
30
-
31
-
32
-
33
-
34
-
35
-
36
-
37
-
38
-
39
-
40
-
41
-
42
-
43
-
44
-
45
-
46
-
47
-
 48
48 -
 49
49 -
 50
50 -
 51
51 -
 52
52 -
 53
53 -
 54
54 -
 55
55 -
 56
56 -
 57
57 -
 58
58 -
 59
59 -
 60
60 -
 61
61 -
 62
62 -
 63
63 -
 64
64 -
 65
65 -
 66
66 -
 67
67 -
 68
68 -
69
-
70
-
71
-
72
-
73
-
74
-
75
-
76
-
77
-
78
-
79
-
80
-
81
-
82
-
83
-
84
-
85
-
86
-
87
-
88
-
89
-
90
-
91
-
92
-
93
-
94
-
95
-
96
-
97
-
98
-
99
-
100
-
101
-
102
-
103
-
104
-
105
-
106
-
107
-
108
-
109
-
110
-
111
-
112
-
113
-
114
-
115
-
116
-
117
-
118
-
119
-
120
 |
 |

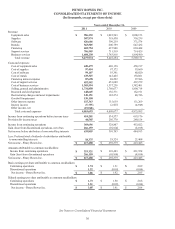
40
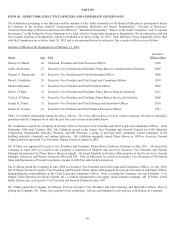
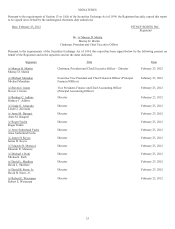
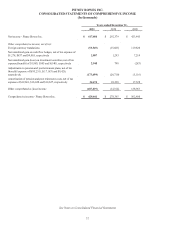
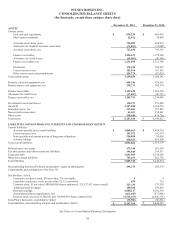
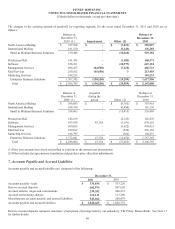
PITNEY BOWES INC.
CONSOLIDATED STATEMENTS OF STOCKHOLDERS' DEFICIT
(In thousands)
Preferred
stock Preference
stock Common
stock
Additional
paid-in
capital Retained
earnings
Accumulated
other
comprehensive
loss Treasury
stock
Balance, December 31, 2008 $ 7 $ 976 $ 323,338 $ 259,306 $ 4,165,503 $ (598,755) $ (4,453,969)
Net income 423,445
Other comprehensive income 138,963
Cash dividends:
Common (297,483)
Preference (72)
Issuances of common stock (22,017) 36,419
Conversions to common stock (3) (108) (2,343) 2,454
Pre-tax stock-based compensation 21,761
Tax benefits from stock compensation plans (574)
Repurchase of common stock
Balance, December 31, 2009 4 868 323,338 256,133 4,291,393 (459,792) (4,415,096)
Net income 292,379
Other comprehensive income (14,014)
Cash dividends:
Common (301,391)
Preference (65)
Issuances of common stock (24,039) 33,249
Conversions to common stock (116) (1,618) 1,734
Pre-tax stock-based compensation 20,452
Repurchase of common stock (100,000)
Balance, December 31, 2010 4 752 323,338 250,928 4,282,316 (473,806) (4,480,113)
Net income 617,480
Other comprehensive income (187,839)
Cash dividends:
Common (299,521)
Preference (58)
Issuances of common stock (27,283) 35,865
Conversions to common stock (93) (2,009) 2,102
Pre-tax stock-based compensation 18,948
Repurchase of common stock (99,997)
Balance, December 31, 2011 $ 4 $ 659 $ 323,338 $ 240,584 $ 4,600,217 $ (661,645) $ (4,542,143)
See Notes to Consolidated Financial Statements