Pitney Bowes 2011 Annual Report Download - page 87
Download and view the complete annual report
Please find page 87 of the 2011 Pitney Bowes annual report below. You can navigate through the pages in the report by either clicking on the pages listed below, or by using the keyword search tool below to find specific information within the annual report.
PITNEY BOWES INC.
NOTES TO CONSOLIDATED FINANCIAL STATEMENTS
(Tabular dollars in thousands, except per share data)
69
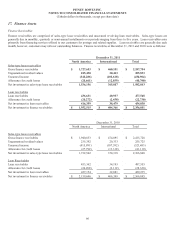
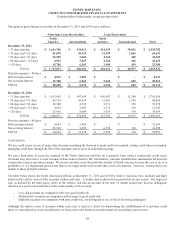
The aging schedule included above, showing approximately 1.4% of the portfolio as greater than 90 days past due, and the roll-
forward schedule of the allowance for credit losses, showing the actual history of losses for the three most recent years ended
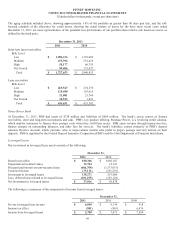
December 31, 2011 are more representative of the potential loss performance of our portfolio than relative risk based on scores, as
defined by the third party.
December 31, 2011
2011 2010
Sales-type lease receivables
Risk Level
Low $ 1,096,676 $ 1,191,682
Medium 473,394 512,419
High 58,177 60,755
Not Scored 99,406 175,977
Total $ 1,727,653 $ 1,940,833
Loan receivables
Risk Level
Low $ 269,547 $ 274,156
Medium 115,490 155,615
High 21,081 21,768
Not Scored 30,513 1,823
Total $ 436,631 $ 453,362
Pitney Bowes Bank
At December 31, 2011, PBB had assets of $738 million and liabilities of $680 million. The bank’s assets consist of finance
receivables, short and long-term investments and cash. PBB’s key product offering, Purchase Power, is a revolving credit solution,
which enables customers to finance their postage costs when they refill their meter. PBB earns revenue through transaction fees,
finance charges on outstanding balances, and other fees for services. The bank’s liabilities consist primarily of PBB’s deposit
solution, Reserve Account, which provides value to large-volume mailers who prefer to prepay postage and earn interest on their
deposits. PBB is regulated by the Federal Deposit Insurance Corporation (FDIC) and the Utah Department of Financial Institutions.
Leveraged Leases
Our investment in leveraged lease assets consists of the following:
December 31,
2011 2010
Rental receivables $ 810,306 $ 1,802,107
Unguaranteed residual values 13,784 14,141
Principal and interest on non-recourse loans (606,708) (1,373,651)
Unearned income (79,111) (191,591)
Investment in leveraged leases 138,271 251,006
Less: deferred taxes related to leveraged leases (101,255) (192,128)
Net investment in leveraged leases $ 37,016 $ 58,878
The following is a summary of the components of income from leveraged leases:
December 31,
2011 2010 2009
Pre-tax leveraged lease income $ 6,090 $ 8,334 $ 918
Income tax effect (381) (863) 6,676
Income from leveraged leases $ 5,709 $ 7,471 $ 7,594


