Pitney Bowes 2011 Annual Report Download - page 80
Download and view the complete annual report
Please find page 80 of the 2011 Pitney Bowes annual report below. You can navigate through the pages in the report by either clicking on the pages listed below, or by using the keyword search tool below to find specific information within the annual report.-
 1
1 -
2
-
3
-
4
-
5
-
6
-
7
-
8
-
9
-
10
-
11
-
12
-
13
-
14
-
15
-
16
-
17
-
18
-
19
-
20
-
21
-
22
-
23
-
24
-
25
-
26
-
27
-
28
-
29
-
30
-
31
-
32
-
33
-
34
-
35
-
36
-
37
-
38
-
39
-
40
-
41
-
42
-
43
-
44
-
45
-
46
-
47
-
48
-
49
-
50
-
51
-
52
-
53
-
54
-
55
-
56
-
57
-
58
-
59
-
60
-
61
-
62
-
63
-
64
-
65
-
66
-
67
-
68
-
69
-
 70
70 -
 71
71 -
 72
72 -
 73
73 -
 74
74 -
 75
75 -
 76
76 -
 77
77 -
 78
78 -
 79
79 -
 80
80 -
 81
81 -
 82
82 -
 83
83 -
 84
84 -
 85
85 -
 86
86 -
 87
87 -
 88
88 -
 89
89 -
 90
90 -
91
-
92
-
93
-
94
-
95
-
96
-
97
-
98
-
99
-
100
-
101
-
102
-
103
-
104
-
105
-
106
-
107
-
108
-
109
-
110
-
111
-
112
-
113
-
114
-
115
-
116
-
117
-
118
-
119
-
120
 |
 |

PITNEY BOWES INC.
NOTES TO CONSOLIDATED FINANCIAL STATEMENTS
(Tabular dollars in thousands, except per share data)
62
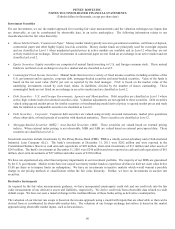
The following represents the results of cash flow hedging relationships for the years ended December 31, 2011 and 2010:
Derivative Gain (Loss)
Recognized in AOCI
(Effective Portion)
Gain (Loss) Reclassified
from AOCI to Earnings
(Effective Portion)
Derivative Instrument 2011 2010 Location of Gain (Loss)
(Effective Portion) 2011 2010
Foreign exchange contracts $ 2,141 $ (470) Revenue $ (166) $ 1,024
Cost of sales (719) (452)
$ (885) $ 572
We also enter into foreign exchange contracts to minimize the impact of exchange rate fluctuations on short-term intercompany loans
and related interest that are denominated in a foreign currency. The revaluation of the intercompany loans and interest and the mark-
to-market on the derivatives are both recorded to earnings. At December 31, 2011, outstanding foreign exchange contracts to buy or
sell various currencies had a net asset value of $2 million. The contracts mature by March 30, 2012. At December 31, 2010,
outstanding foreign exchange contracts to buy or sell various currencies had a net liability value of $3 million.
The following represents the results of our non-designated derivative instruments for the years ended December 31, 2011 and 2010:
Derivative Gain (Loss)
Recognized in Earnings
Derivative Instrument Location of Derivative Gain (Loss) 2011 2010
Foreign exchange contracts Selling, general and administrative expense $ (17,214) $ (22,158)
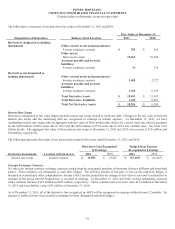
Credit-Risk-Related Contingent Features
We are not required to post collateral with respect to our derivative instruments; however, certain derivative instruments contain
provisions that would require us to post collateral if our long-term senior unsecured debt ratings fall below BB- / Ba3. At December
31, 2011, our long-term senior unsecured debt ratings were BBB+ / A2. Based on derivative values at December 31, 2011, had our
long-term debt ratings fallen below BB- / Ba3, we would have been required to post $1 million in collateral.
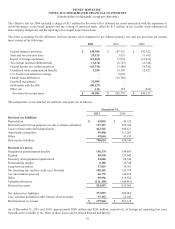
Fair Value of Financial Instruments
Our financial instruments include cash and cash equivalents, investment securities, accounts receivable, loans receivable, accounts
payable, notes payable, long-term debt and derivative instruments. The carrying value for cash and cash equivalents, accounts
receivable, accounts payable and notes payable approximate fair value because of the short maturity of these instruments. The
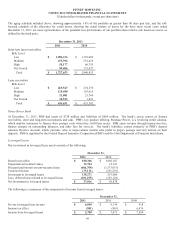
carrying values and estimated fair value of our remaining financial instruments at December 31, 2011 and 2010 was as follows:
December 31, 2011 December 31, 2010
Carrying value Fair value Carrying value Fair value
Investment securities $ 860,614 $ 867,649 $ 538,562 $ 540,697
Loan receivables $ 454,838 $ 454,838 $ 459,235 $ 459,235
Derivatives, net $ 18,256 $ 18,256 $ 6,260 $ 6,260
Debt $ 4,233,909 $ 4,364,176 $ 4,289,248 $ 4,376,834
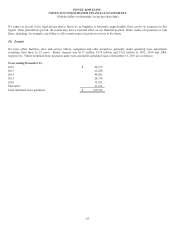
The following methods were used to estimate the fair values of other financial instruments:
Investment securities – the fair value of investment securities was based on quoted market prices on an active exchange where
available or based on quoted market prices for similar securities, benchmarking model derived prices, bond spreads or other
observable data.
Loan receivables – the fair value of loan receivables is based on anticipated cash flows, which approximates carrying value.
Debt – The fair value of debt is estimated based on quoted market prices for the identical issue when traded in an active market.
When a quoted market price is not available, the fair value is determined using rates currently available to the Company for debt with
similar terms and remaining maturities.