Pitney Bowes 2011 Annual Report Download - page 84
Download and view the complete annual report
Please find page 84 of the 2011 Pitney Bowes annual report below. You can navigate through the pages in the report by either clicking on the pages listed below, or by using the keyword search tool below to find specific information within the annual report.-
 1
1 -
2
-
3
-
4
-
5
-
6
-
7
-
8
-
9
-
10
-
11
-
12
-
13
-
14
-
15
-
16
-
17
-
18
-
19
-
20
-
21
-
22
-
23
-
24
-
25
-
26
-
27
-
28
-
29
-
30
-
31
-
32
-
33
-
34
-
35
-
36
-
37
-
38
-
39
-
40
-
41
-
42
-
43
-
44
-
45
-
46
-
47
-
48
-
49
-
50
-
51
-
52
-
53
-
54
-
55
-
56
-
57
-
58
-
59
-
60
-
61
-
62
-
63
-
64
-
65
-
66
-
67
-
68
-
69
-
70
-
71
-
72
-
73
-
 74
74 -
 75
75 -
 76
76 -
 77
77 -
 78
78 -
 79
79 -
 80
80 -
 81
81 -
 82
82 -
 83
83 -
 84
84 -
 85
85 -
 86
86 -
 87
87 -
 88
88 -
 89
89 -
 90
90 -
 91
91 -
 92
92 -
 93
93 -
 94
94 -
95
-
96
-
97
-
98
-
99
-
100
-
101
-
102
-
103
-
104
-
105
-
106
-
107
-
108
-
109
-
110
-
111
-
112
-
113
-
114
-
115
-
116
-
117
-
118
-
119
-
120
 |
 |

PITNEY BOWES INC.
NOTES TO CONSOLIDATED FINANCIAL STATEMENTS
(Tabular dollars in thousands, except per share data)
66
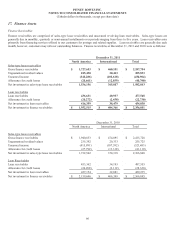
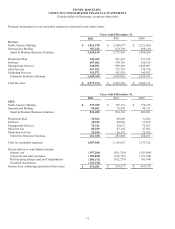
17. Finance Assets
Finance Receivables
Finance receivables are comprised of sales-type lease receivables and unsecured revolving loan receivables. Sales-type leases are
generally due in monthly, quarterly or semi-annual installments over periods ranging from three to five years. Loan receivables arise
primarily from financing services offered to our customers for postage and related supplies. Loan receivables are generally due each
month; however, customers may rollover outstanding balances. Finance receivables at December 31, 2011 and 2010 were as follows:
December 31, 2011
North America International Total
Sales-type lease receivables
Gross finance receivables $ 1,727,653 $ 460,101 $ 2,187,754
Unguaranteed residual values 185,450 20,443 205,893
Unearned income (348,286) (102,618) (450,904)
Allowance for credit losses (28,661) (12,039) (40,700)
Net investment in sales-type lease receivables 1,536,156 365,887 1,902,043
Loan receivables
Loan receivables 436,631 40,937 477,568
Allowance for credit losses (20,272) (2,458) (22,730)
Net investment in loan receivables 416,359 38,479 454,838
Net investment in finance receivables $ 1,952,515 $ 404,366 $ 2,356,881
December 31, 2010
North America International Total
Sales-type lease receivables
Gross finance receivables $ 1,940,833 $ 474,895 $ 2,415,728
Unguaranteed residual values 235,392 20,333 255,725
Unearned income (415,891) (107,592) (523,483)
Allowance for credit losses (27,792) (13,318) (41,110)
Net investment in sales-type lease receivables 1,732,542 374,318 2,106,860
Loan Receivables
Loan receivables 453,362 34,193 487,555
Allowance for credit losses (26,208) (2,112) (28,320)
Net investment in loan receivables 427,154 32,081 459,235
Net investment in finance receivables $ 2,159,696 $ 406,399 $ 2,566,095