Pitney Bowes 2011 Annual Report Download - page 32
Download and view the complete annual report
Please find page 32 of the 2011 Pitney Bowes annual report below. You can navigate through the pages in the report by either clicking on the pages listed below, or by using the keyword search tool below to find specific information within the annual report.-
 1
1 -
2
-
3
-
4
-
5
-
6
-
7
-
8
-
9
-
10
-
11
-
12
-
13
-
14
-
15
-
16
-
17
-
18
-
19
-
20
-
21
-
 22
22 -
 23
23 -
 24
24 -
 25
25 -
 26
26 -
 27
27 -
 28
28 -
 29
29 -
 30
30 -
 31
31 -
 32
32 -
 33
33 -
 34
34 -
 35
35 -
 36
36 -
 37
37 -
 38
38 -
 39
39 -
 40
40 -
 41
41 -
 42
42 -
43
-
44
-
45
-
46
-
47
-
48
-
49
-
50
-
51
-
52
-
53
-
54
-
55
-
56
-
57
-
58
-
59
-
60
-
61
-
62
-
63
-
64
-
65
-
66
-
67
-
68
-
69
-
70
-
71
-
72
-
73
-
74
-
75
-
76
-
77
-
78
-
79
-
80
-
81
-
82
-
83
-
84
-
85
-
86
-
87
-
88
-
89
-
90
-
91
-
92
-
93
-
94
-
95
-
96
-
97
-
98
-
99
-
100
-
101
-
102
-
103
-
104
-
105
-
106
-
107
-
108
-
109
-
110
-
111
-
112
-
113
-
114
-
115
-
116
-
117
-
118
-
119
-
120
 |
 |

14
in Europe, delayed capital investment commitments. EBIT decreased 47% to $33 million compared to last year due to lower revenue
and the expenses incurred in the development of VollyTM, our secure digital mail delivery service.
Software revenue increased 9% to $407 million compared to the prior year. Foreign currency translation had a 3% favorable impact
on revenue and prior year acquisitions accounted for 3% of the increase. The remaining increase was primarily due to higher licensing
revenue in most regions, particularly North America and Asia Pacific. We continue to enter into multi-year software licensing
agreements, which will provide improved recurring revenue streams in future periods. EBIT decreased 5% to $38 million compared
to last year due to higher selling costs as a percentage of revenue. Foreign currency had a favorable impact of 7% on EBIT.
Management Services revenue decreased 5% to $949 million compared to the prior year. Foreign currency translation had a positive
impact of 1%. EBIT decreased 18% to $76 million compared to the prior year. The decrease in revenue and EBIT was primarily due
to account contractions and terminations in the U.S. last year and pricing pressure on new business and contract renewals.
Mail Services revenue decreased 1% to $567 million compared to the prior year primarily due to a reduction in cross-border mail and
package shipments. EBIT increased 39% to $88 million compared to the prior year. EBIT in 2011 includes a benefit of $7 million
related to the Dallas mail presort facility fire from the insurance recoveries of $27 million recognized in other income net of the lost
revenue of approximately $20 million. We expect higher depreciation costs in future years related to the new equipment. The 2010
results include a one-time out of period adjustment that reduced revenue by $21 million and EBIT by $16 million. Excluding the
impacts of these items, EBIT increased 2%.
Marketing Services revenue of $142 million and EBIT of $26 million was flat compared to the prior year.
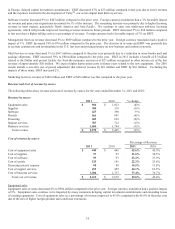
Revenue and Cost of revenue by source
The following tables show revenue and cost of revenue by source for the years ended December 31, 2011 and 2010:
Revenue by source
2011 2010 % change
Equipment sales $986 $1,023 (4)%
Supplies 308 318 (3)%
Software 427 390 9 %
Rentals 564 601 (6)%
Financing 603 638 (6)%
Support services 707 712 (1)%
Business services 1,684 1,744 (3)%
Total revenue $5,278 $5,425 (3)%
Cost of revenue by source
Percentage of Revenue
2011 2010 2011 2010
Cost of equipment sales $449 $469 45.6% 45.9%
Cost of supplies 97 97 31.6% 30.5%
Cost of software 99 93 23.2% 23.9%
Cost of rentals 125 141 22.2% 23.6%
Financing interest expense 88 88 14.5% 13.8%
Cost of support services 453 452 64.1% 63.5%
Cost of business services 1,304 1,337 77.4% 76.7%
Total cost of revenue $2,615 $2,678 49.6% 49.4%
Equipment sales
Equipment sales revenue decreased 4% to $986 million compared to the prior year. Foreign currency translation had a positive impact
of 2%. Equipment sales continue to be impacted by many customers delaying capital investment commitments and extending leases
of existing equipment. Cost of equipment sales as a percentage of revenue improved to 45.6% compared with 45.9% in the prior year
due to the mix of higher margin product sales and lease extensions.