Pitney Bowes 2011 Annual Report Download - page 15
Download and view the complete annual report
Please find page 15 of the 2011 Pitney Bowes annual report below. You can navigate through the pages in the report by either clicking on the pages listed below, or by using the keyword search tool below to find specific information within the annual report.
13Pitney Bowes Annual Report 2011
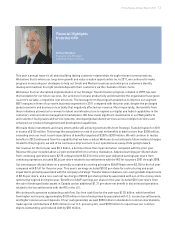
This year’s annual report is all about building lasting customer relationships through relevant communications.
We believe that is where our long-term growth and value creation opportunities lie. In 2011, we continued to make
progress in executing our strategies to help our Small and Medium business and enterprise customers identify,
develop and maintain the right relationships with their customers via the channels of their choice.
We believe that our disciplined implementation of our Strategic Transformation program, initiated in 2009, has laid
the foundation for our future success. Our actions to increase productivity and streamline the organization have given
us a more variable, competitive cost structure. The leverage from the program enabled us to improve our segment
EBIT margins in three of our seven business segments for 2011 compared with the prior year, despite the prolonged
global economic and business uncertainty that negatively affected our revenue. Most importantly, the benefits from
these initiatives allowed us to reinvest in talent and infrastructure to expand our digital and hybrid capabilities in the
customer communications management marketplace. We have made significant investments in our Web platform
and customer-facing sales and service systems; developed global shared services across multiple functions; and
enhanced our product management and development capabilities.
We made these investments and many others while still achieving net benefits from Strategic Transformation for 2011
in excess of $135 million. This brings the annualized run rate of our total net benefits to date to more than $300 million,
exceeding even our most recent expectations of benefits targeted at $250 to $300 million. We will continue to realize
benefits in 2012 and beyond from the capability that we have created. While we do not anticipate future material charges
related to this program, we will drive continuous improvement in our operations as a way of life going forward.
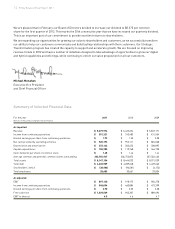
Our revenue for the full year was $5.3 billion, a decline of less than 3 percent when compared with the prior year.
Revenue this year included about a 2 percent benefit from currency translation. Adjusted earnings per diluted share
from continuing operations were $2.70 compared with $2.23 for the prior year. Adjusted earnings per share from
continuing operations included $0.44 per share related to tax settlements with the IRS for tax years 2001 through 2008.
Our earnings per diluted share on a generally accepted accounting principles (GAAP) basis were $3.05 for the full year
compared with $1.41 for the prior year. This year’s earnings included $0.52 per share for restructuring and asset
impairments primarily associated with the company’s Strategic Transformation initiatives; non-cash goodwill impairments
of $0.56 per share; and a non-cash net tax charge of $0.02 per share primarily associated with out-of-the-money stock
options that expired during the year. Benefits to GAAP earnings per share for the year included $0.13 per share from
the sale of leveraged lease assets in Canada and an additional $1.31 per share net benefit in discontinued operations
related to the tax settlements with the IRS in the U.S.
We continued to generate outstanding cash flow. Our free cash flow for the year was $1.03 billion, which benefited
from higher net income, approximately $130 million in tax refunds primarily associated with U.S. income tax settlements,
and higher reserve account deposits. Of our cash generated, we paid $300 million in dividends to common shareholders;
made special contributions of $123 million to our U.S. pension plan; used $100 million to repurchase our common
shares outstanding; and reduced debt by $50 million.
Financial Highlights
from Our CFO
Michael Monahan
Executive Vice President
and Chief Financial Officer


