Pitney Bowes 2011 Annual Report Download - page 38
Download and view the complete annual report
Please find page 38 of the 2011 Pitney Bowes annual report below. You can navigate through the pages in the report by either clicking on the pages listed below, or by using the keyword search tool below to find specific information within the annual report.-
 1
1 -
2
-
3
-
4
-
5
-
6
-
7
-
8
-
9
-
10
-
11
-
12
-
13
-
14
-
15
-
16
-
17
-
18
-
19
-
20
-
21
-
22
-
23
-
24
-
25
-
26
-
27
-
 28
28 -
 29
29 -
 30
30 -
 31
31 -
 32
32 -
 33
33 -
 34
34 -
 35
35 -
 36
36 -
 37
37 -
 38
38 -
 39
39 -
 40
40 -
 41
41 -
 42
42 -
 43
43 -
 44
44 -
 45
45 -
 46
46 -
 47
47 -
 48
48 -
49
-
50
-
51
-
52
-
53
-
54
-
55
-
56
-
57
-
58
-
59
-
60
-
61
-
62
-
63
-
64
-
65
-
66
-
67
-
68
-
69
-
70
-
71
-
72
-
73
-
74
-
75
-
76
-
77
-
78
-
79
-
80
-
81
-
82
-
83
-
84
-
85
-
86
-
87
-
88
-
89
-
90
-
91
-
92
-
93
-
94
-
95
-
96
-
97
-
98
-
99
-
100
-
101
-
102
-
103
-
104
-
105
-
106
-
107
-
108
-
109
-
110
-
111
-
112
-
113
-
114
-
115
-
116
-
117
-
118
-
119
-
120
 |
 |

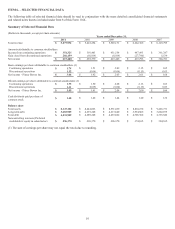
20
Preferred stock dividends of subsidiaries attributable to noncontrolling interests
See Note 10 to the Consolidated Financial Statements for further discussion.
Restructuring Charges and Asset Impairments
Restructuring charges and asset impairments were $148 million, $182 million and $49 million for the years ended December 31, 2011,
2010 and 2009, respectively. See Note 14 to the Consolidated Financial Statements for further discussion.
In 2009, we announced that we were undertaking a series of strategic transformation initiatives designed to transform and enhance the
way we operate as a global company (the 2009 Program). The program aims to enhance our responsiveness to changing market
conditions and create improved processes and systems to further enable us to invest in future growth in areas such as our global
customer interactions and product development processes. Total pre-tax costs for this program were approximately $385 million. At
the end of 2011, the 2009 Program is substantially completed and annualized run-rate net benefits of this program are projected to be
approximately $300 million in 2012. We do not anticipate any further significant charges under this program. Most of the costs were
cash-related charges. The majority of the remaining restructuring payments are expected to be paid over the next 12 – 24 months.
Due to certain international labor laws and long-term lease agreements, some payments will extend beyond 24 months. We expect
that cash flows from operations will be sufficient to fund these payments.
LIQUIDITY AND CAPITAL RESOURCES
We believe that cash flow from operations, existing cash and investments, as well as borrowing capacity under our commercial paper
program should be sufficient to support our business operations, interest and dividend payments, share repurchases, capital
expenditures, and to cover customer deposits. We have the ability to supplement this short-term liquidity, if necessary, and fund the
long-term needs of our business through broad access to capital markets, a credit line facility, and our effective shelf registration
statement. At December 31, 2011, cash and cash equivalents and short-term investments on hand were $869 million.
Cash and cash equivalents held by our foreign subsidiaries are generally used to support the liquidity needs of these subsidiaries.
Most of these amounts could be repatriated to the United States but would be subject to additional taxes. Repatriation of some foreign
balances is restricted by local laws. It is our intention to permanently reinvest substantially all of these funds in our foreign
operations. Cash and cash equivalents held by our foreign subsidiaries at December 31, 2011 and 2010 were $538 million and $166
million, respectively.
We continuously review our liquidity profile through published credit ratings and the credit default swap market. We monitor the
creditworthiness of those banks acting as derivative counterparties, depository banks or credit providers. There has not been a
material variation in the underlying sources of cash flows currently used to finance the operations of the Company. To date, we have
had consistent access to the commercial paper market.
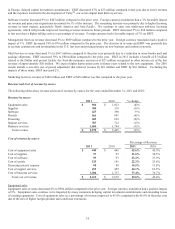
Cash Flow Summary
The change in cash and cash equivalents is as follows:
2011 2010 2009
Net cash provided by operating activities $ 920 $ 952 $ 824
Net cash used in investing activities (89) (301) (172)
Net cash used in financing activities (455) (580) (626)
Effect of exchange rate changes on cash (5) 1 10
Increase in cash and cash equivalents $ 372 $ 72 $ 36
2011 Cash Flows
Net cash provided by operating activities consists primarily of net income adjusted for non-cash items and changes in operating assets
and liabilities. A decrease in finance receivables contributed $190 million of cash as cash collections exceeded the financing of new
business and a decrease in accounts receivables contributed $59 million in cash primarily due to improved cash collections in excess
of new billings. The decrease in current and non-current income taxes of $258 million includes the tax benefits recognized in
connection with the 2001-2008 IRS tax settlements. Cash flow from operations also includes a special contribution to our U.S.
pension plan of $123 million and restructuring payments of $107 million.
Net cash used in investing activities consisted of capital expenditures of $156 million for property, plant and equipment and rental
equipment and related inventories and the net purchase of investment securities of $68 million partially offset by the proceeds from
the sale of non-U.S. leveraged lease assets of $102 million.