Pitney Bowes 2011 Annual Report Download - page 103
Download and view the complete annual report
Please find page 103 of the 2011 Pitney Bowes annual report below. You can navigate through the pages in the report by either clicking on the pages listed below, or by using the keyword search tool below to find specific information within the annual report.-
 1
1 -
2
-
3
-
4
-
5
-
6
-
7
-
8
-
9
-
10
-
11
-
12
-
13
-
14
-
15
-
16
-
17
-
18
-
19
-
20
-
21
-
22
-
23
-
24
-
25
-
26
-
27
-
28
-
29
-
30
-
31
-
32
-
33
-
34
-
35
-
36
-
37
-
38
-
39
-
40
-
41
-
42
-
43
-
44
-
45
-
46
-
47
-
48
-
49
-
50
-
51
-
52
-
53
-
54
-
55
-
56
-
57
-
58
-
59
-
60
-
61
-
62
-
63
-
64
-
65
-
66
-
67
-
68
-
69
-
70
-
71
-
72
-
73
-
74
-
75
-
76
-
77
-
78
-
79
-
80
-
81
-
82
-
83
-
84
-
85
-
86
-
87
-
88
-
89
-
90
-
91
-
92
-
 93
93 -
 94
94 -
 95
95 -
 96
96 -
 97
97 -
 98
98 -
 99
99 -
 100
100 -
 101
101 -
 102
102 -
 103
103 -
 104
104 -
 105
105 -
 106
106 -
 107
107 -
 108
108 -
 109
109 -
 110
110 -
 111
111 -
 112
112 -
 113
113 -
114
-
115
-
116
-
117
-
118
-
119
-
120
 |
 |

PITNEY BOWES INC.
NOTES TO CONSOLIDATED FINANCIAL STATEMENTS
(Tabular dollars in thousands, except per share data)
85
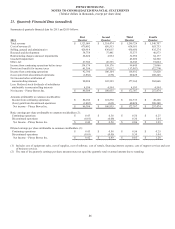
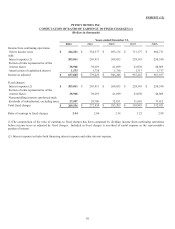
20. Earnings per Share
The calculation of basic and diluted earnings per share for the years ended December 31, 2011, 2010 and 2009 is presented below.
Note that the sum of earnings per share amounts may not equal the total due to rounding.
2011 2010 2009
Numerator:
Amounts attributable to common stockholders:
Income from continuing operations $ 351,321 $ 310,483 $ 431,554
Gain (loss) from discontinued operations 266,159 (18,104) (8,109)
Net income - Pitney Bowes Inc. (numerator for
diluted EPS) 617,480 292,379 423,445
Less: Preference stock dividend 58 65 72
Income attributable to common stockholders
(numerator for basic EPS) $ 617,422 $ 292,314 $ 423,373
Denominator (in thousands):
Weighted-average shares used in basic EPS 201,976 205,968 206,734
Effect of dilutive shares:
Preferred stock 2 2 3
Preference stock 445 501 568
Stock plans 343 282 17
Weighted-average shares used in diluted EPS 202,766 206,753 207,322
Basic earnings per share:
Continuing operations $ 1.74 $ 1.51 $ 2.09
Discontinued operations 1.32 (0.09) (0.04)
Net income - Pitney Bowes Inc. $ 3.06 $ 1.42 $ 2.05
Diluted earnings per share:
Continuing operations $ 1.73 $ 1.50 $ 2.08
Discontinued operations 1.31 (0.09) (0.04)
Net income - Pitney Bowes Inc. $ 3.05 $ 1.41 $ 2.04
Anti-dilutive shares (in thousands):
Anti-dilutive shares not used in calculating
diluted weighted-average shares 14,016 15,168 18,319