Pitney Bowes 2011 Annual Report Download - page 17
Download and view the complete annual report
Please find page 17 of the 2011 Pitney Bowes annual report below. You can navigate through the pages in the report by either clicking on the pages listed below, or by using the keyword search tool below to find specific information within the annual report.-
 1
1 -
2
-
3
-
4
-
5
-
6
-
 7
7 -
 8
8 -
 9
9 -
 10
10 -
 11
11 -
 12
12 -
 13
13 -
 14
14 -
 15
15 -
 16
16 -
 17
17 -
 18
18 -
 19
19 -
 20
20 -
 21
21 -
 22
22 -
 23
23 -
 24
24 -
 25
25 -
 26
26 -
 27
27 -
28
-
29
-
30
-
31
-
32
-
33
-
34
-
35
-
36
-
37
-
38
-
39
-
40
-
41
-
42
-
43
-
44
-
45
-
46
-
47
-
48
-
49
-
50
-
51
-
52
-
53
-
54
-
55
-
56
-
57
-
58
-
59
-
60
-
61
-
62
-
63
-
64
-
65
-
66
-
67
-
68
-
69
-
70
-
71
-
72
-
73
-
74
-
75
-
76
-
77
-
78
-
79
-
80
-
81
-
82
-
83
-
84
-
85
-
86
-
87
-
88
-
89
-
90
-
91
-
92
-
93
-
94
-
95
-
96
-
97
-
98
-
99
-
100
-
101
-
102
-
103
-
104
-
105
-
106
-
107
-
108
-
109
-
110
-
111
-
112
-
113
-
114
-
115
-
116
-
117
-
118
-
119
-
120
 |
 |

15Pitney Bowes Annual Report 2011
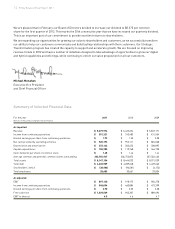
Reconciliation of Reported Consolidated
Results to Adjusted Results
For the year 2011 2010 2009
(Dollars in thousands, except per share amounts)
GAAP income from continuing operations before income taxes,
as reported $ 414,281 $ 534,577 $ 693,176
Restructuring charges and asset impairments 148,151 182,274 48,746
Goodwill impairment 130,150 — —
Sale of leveraged lease 7,282 — —
Other income and expense — — 4,450
Income from continuing operations before income taxes, as adjusted 699,864 716,851 746,372
Provision for income taxes, as adjusted 133,395 237,643 251,505
Preferred stock dividends of subsidiaries attributable to
noncontrolling interests 18,375 18,324 21,468
Income from continuing operations, as adjusted 548,094 460,884 473,399
Interest expense, net 197,266 201,324 203,906
Provision for income taxes, as adjusted 133,395 237,643 251,505
Preferred stock dividends of subsidiaries attributable to
noncontrolling interests 18,375 18,324 21,468
EBIT $ 897,130 $ 918,175 $ 950,278
GAAP diluted earnings per share, as reported $ 3.05 $ 1.41 $ 2.04
(Gain) loss from discontinued operations (1.31) 0.09 0.04
GAAP diluted earnings per share from continuing operations,
as reported 1.73 1.50 2.08
Restructuring charges and asset impairments 0.52 0.59 0.15
Goodwill impairment 0.56 — —
Other income and expense (0.13) — —
Tax adjustments 0.02 0.13 0.05
Diluted earnings per share from continuing operations, as adjusted $ 2.70 $ 2.23 $ 2.28
GAAP net cash provided by operating activities, as reported $ 920,193 $ 952,111 $ 824,068
Capital expenditures (155,980) (119,768) (166,728)
Free cash flow 764,213 832,343 657,340
Payments related to restructuring charges 107,002 119,565 105,090
Reserve account deposits 35,354 10,399 1,664
Pension plan contributions 123,000 — 125,000
Free cash flow, as adjusted $ 1,029,569 $ 962,307 $ 889,094
The sum of the earnings per share amounts may not equal the totals above due to rounding.
Management believes this presentation provides a reasonable basis on which to present the adjusted financial information. The Company’s financial results are reported in accordance
with generally accepted accounting principles (GAAP). The earnings per share and free cash flow results are adjusted to exclude the impact of special items such as restructuring charges and
asset impairment, goodwill impairment charges and other income and expense which materially impact the comparability of the Company’s results of operations. The use of free cash flow has
limitations. GA AP cash flow has the advantage of including all cash available to the Company after actual expenditures for all purposes. Free cash flow is the amount of cash that management
could have available for discretionary uses if it made different decisions about employing its cash. It adjusts for long-term commitments such as capital expenditures, as well as special items
such as cash used for restructuring charges and contributions to its pension funds. All of these items use cash that is not otherwise available to the Company and are important expenditures.
Management compensates for these limitations by using a combination of GAAP cash flow and free cash flow in doing its planning.
The adjusted financial information and certain financial measures such as earnings before interest and taxes (EBIT) and EBIT to interest are intended to be more indicative of the ongoing
operations and economic results of the Company. EBIT excludes interest and taxes, and as a result has the effect of showing a greater amount of earnings than net income. The Company
believes that interest and taxes, though important, do not reflect management effectiveness as these items are largely outside of its control. In assessing performance, the Company uses both
EBIT and net income.
This adjusted financial information should not be construed as an alternative to our reported results determined in accordance with GAAP. Further, our definition of this adjusted financial
information may differ from similarly titled measures used by other companies.