Pitney Bowes 2011 Annual Report Download - page 104
Download and view the complete annual report
Please find page 104 of the 2011 Pitney Bowes annual report below. You can navigate through the pages in the report by either clicking on the pages listed below, or by using the keyword search tool below to find specific information within the annual report.-
 1
1 -
2
-
3
-
4
-
5
-
6
-
7
-
8
-
9
-
10
-
11
-
12
-
13
-
14
-
15
-
16
-
17
-
18
-
19
-
20
-
21
-
22
-
23
-
24
-
25
-
26
-
27
-
28
-
29
-
30
-
31
-
32
-
33
-
34
-
35
-
36
-
37
-
38
-
39
-
40
-
41
-
42
-
43
-
44
-
45
-
46
-
47
-
48
-
49
-
50
-
51
-
52
-
53
-
54
-
55
-
56
-
57
-
58
-
59
-
60
-
61
-
62
-
63
-
64
-
65
-
66
-
67
-
68
-
69
-
70
-
71
-
72
-
73
-
74
-
75
-
76
-
77
-
78
-
79
-
80
-
81
-
82
-
83
-
84
-
85
-
86
-
87
-
88
-
89
-
90
-
91
-
92
-
93
-
 94
94 -
 95
95 -
 96
96 -
 97
97 -
 98
98 -
 99
99 -
 100
100 -
 101
101 -
 102
102 -
 103
103 -
 104
104 -
 105
105 -
 106
106 -
 107
107 -
 108
108 -
 109
109 -
 110
110 -
 111
111 -
 112
112 -
 113
113 -
 114
114 -
115
-
116
-
117
-
118
-
119
-
120
 |
 |

PITNEY BOWES INC.
NOTES TO CONSOLIDATED FINANCIAL STATEMENTS
(Tabular dollars in thousands, except per share data)
86
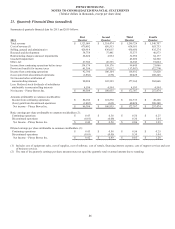
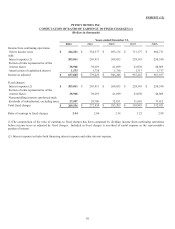
21. Quarterly Financial Data (unaudited)
Summarized quarterly financial data for 2011 and 2010 follows:
2011 First
Quarter Second
Quarter Third
Quarter Fourth
Quarter
Total revenue $ 1,323,069 $ 1,314,474 $ 1,299,724 $ 1,340,707
Cost of revenue (1) 670,892 650,513 638,101 655,733
Selling, general and administrative 429,919 436,015 430,650 435,274
Research and development 34,758 37,441 35,573 40,873
Restructuring charges and asset impairments 26,024 4,994 32,956 84,177
Goodwill impairment - - 45,650 84,500
Other, net 27,302 26,335 16,949 19,064
Income from continuing operations before taxes 134,174 159,176 99,845 21,086
Provision (benefit) for income taxes 41,394 53,012 (17,087) (32,734)
Income from continuing operations 92,780 106,164 116,932 53,820
(Loss) gain from discontinued operations (1,882) (635) 60,428 208,248
Net income before attribution of
noncontrolling interests 90,898 105,529 177,360 262,068
Less: Preferred stock dividends of subsidiaries
attributable to noncontrolling interests 4,594 4,594 4,593 4,594
Net income – Pitney Bowes Inc. $ 86,304 $ 100,935 $ 172,767 $ 257,474
Amounts attributable to common stockholders:
Income from continuing operations $ 88,186 $ 101,570 $ 112,339 $ 49,226
(Loss) gain from discontinued operations (1,882) (635) 60,428 208,248
Net income – Pitney Bowes Inc. $ 86,304 $ 100,935 $ 172,767 $ 257,474
Basic earnings per share attributable to common stockholders (2):
Continuing operations $ 0.43 $ 0.50 $ 0.56 $ 0.25
Discontinued operations (0.01) (0.00) 0.30 1.04
Net Income – Pitney Bowes Inc. $ 0.42 $ 0.50 $ 0.86 $ 1.29
Diluted earnings per share attributable to common stockholders (2):
Continuing operations $ 0.43 $ 0.50 $ 0.56 $ 0.25
Discontinued operations (0.01) (0.00) 0.30 1.04
Net Income – Pitney Bowes Inc. $ 0.42 $ 0.49 $ 0.85 $ 1.28
(1) Includes cost of equipment sales, cost of supplies, cost of software, cost of rentals, financing interest expense, cost of support services and cost
of business services.
(2) The sum of the quarterly earnings per share amounts may not equal the quarterly total or annual amount due to rounding.