Pitney Bowes 2011 Annual Report Download - page 101
Download and view the complete annual report
Please find page 101 of the 2011 Pitney Bowes annual report below. You can navigate through the pages in the report by either clicking on the pages listed below, or by using the keyword search tool below to find specific information within the annual report.-
 1
1 -
2
-
3
-
4
-
5
-
6
-
7
-
8
-
9
-
10
-
11
-
12
-
13
-
14
-
15
-
16
-
17
-
18
-
19
-
20
-
21
-
22
-
23
-
24
-
25
-
26
-
27
-
28
-
29
-
30
-
31
-
32
-
33
-
34
-
35
-
36
-
37
-
38
-
39
-
40
-
41
-
42
-
43
-
44
-
45
-
46
-
47
-
48
-
49
-
50
-
51
-
52
-
53
-
54
-
55
-
56
-
57
-
58
-
59
-
60
-
61
-
62
-
63
-
64
-
65
-
66
-
67
-
68
-
69
-
70
-
71
-
72
-
73
-
74
-
75
-
76
-
77
-
78
-
79
-
80
-
81
-
82
-
83
-
84
-
85
-
86
-
87
-
88
-
89
-
90
-
 91
91 -
 92
92 -
 93
93 -
 94
94 -
 95
95 -
 96
96 -
 97
97 -
 98
98 -
 99
99 -
 100
100 -
 101
101 -
 102
102 -
 103
103 -
 104
104 -
 105
105 -
 106
106 -
 107
107 -
 108
108 -
 109
109 -
 110
110 -
 111
111 -
112
-
113
-
114
-
115
-
116
-
117
-
118
-
119
-
120
 |
 |

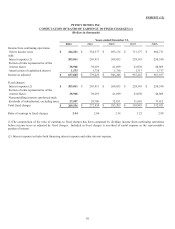
PITNEY BOWES INC.
NOTES TO CONSOLIDATED FINANCIAL STATEMENTS
(Tabular dollars in thousands, except per share data)
83
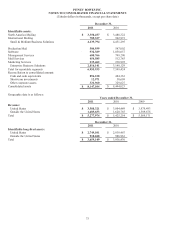
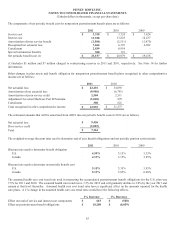
The components of net periodic benefit cost for nonpension postretirement benefit plans are as follows:
2011 2010 2009
Service cost $ 3,328 $ 3,724 $ 3,424
Interest cost 13,528 13,828 14,437
Amortization of prior service benefit (2,504) (2,511) (2,475)
Recognized net actuarial loss 7,666 6,793 4,092
Curtailment 2,839 6,954 -
Special termination benefits 300 191 -
Net periodic benefit cost (1) $ 25,157 $ 28,979 $ 19,478
(1) Includes $3 million and $7 million charged to restructuring reserves in 2011 and 2010, respectively. See Note 14 for further
information.
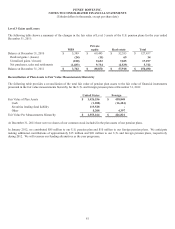
Other changes in plan assets and benefit obligation for nonpension postretirement benefit plans recognized in other comprehensive
income are as follows:
2011 2010
Net actuarial loss $ 22,201 $ 34,059
Amortization of net actuarial loss (9,980) (6,793)
Amortization of prior service credit 2,504 2,511
Adjustment for actual Medicare Part D Premium (2,040) 979
Curtailment 308 621
Total recognized in other comprehensive income $ 12,993 $ 31,377
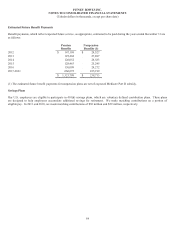
The estimated amounts that will be amortized from AOCI into net periodic benefit costs in 2012 are as follows:
Net actuarial loss $ 9,456
Prior service credit (2,092)
Total $ 7,364
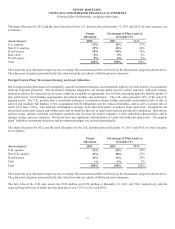
The weighted-average discount rates used to determine end of year benefit obligations and net periodic pension costs include:
2011 2010 2009
Discount rate used to determine benefit obligation
U.S. 4.50% 5.15% 5.35%
Canada 4.15% 5.15% 5.85%
Discount rate used to determine net periodic benefit cost
U.S. 5.15% 5.35% 5.95%
Canada 5.15% 5.85% 6.60%
The assumed health care cost trend rate used in measuring the accumulated postretirement benefit obligations for the U.S. plan was
7.5% for 2011 and 2010. The assumed health care trend rate is 7.5% for 2012 and will gradually decline to 5.0% by the year 2017 and
remain at that level thereafter. Assumed health care cost trend rates have a significant effect on the amounts reported for the health
care plans. A 1% change in the assumed health care cost trend rates would have the following effects:
1% Increase 1% Decrease
Effect on total of service and interest cost components $ 615 $ (520)
Effect on postretirement benefit obligations $ 10,208 $ (8,859)