Pitney Bowes 2011 Annual Report Download - page 73
Download and view the complete annual report
Please find page 73 of the 2011 Pitney Bowes annual report below. You can navigate through the pages in the report by either clicking on the pages listed below, or by using the keyword search tool below to find specific information within the annual report.-
 1
1 -
2
-
3
-
4
-
5
-
6
-
7
-
8
-
9
-
10
-
11
-
12
-
13
-
14
-
15
-
16
-
17
-
18
-
19
-
20
-
21
-
22
-
23
-
24
-
25
-
26
-
27
-
28
-
29
-
30
-
31
-
32
-
33
-
34
-
35
-
36
-
37
-
38
-
39
-
40
-
41
-
42
-
43
-
44
-
45
-
46
-
47
-
48
-
49
-
50
-
51
-
52
-
53
-
54
-
55
-
56
-
57
-
58
-
59
-
60
-
61
-
62
-
 63
63 -
 64
64 -
 65
65 -
 66
66 -
 67
67 -
 68
68 -
 69
69 -
 70
70 -
 71
71 -
 72
72 -
 73
73 -
 74
74 -
 75
75 -
 76
76 -
 77
77 -
 78
78 -
 79
79 -
 80
80 -
 81
81 -
 82
82 -
 83
83 -
84
-
85
-
86
-
87
-
88
-
89
-
90
-
91
-
92
-
93
-
94
-
95
-
96
-
97
-
98
-
99
-
100
-
101
-
102
-
103
-
104
-
105
-
106
-
107
-
108
-
109
-
110
-
111
-
112
-
113
-
114
-
115
-
116
-
117
-
118
-
119
-
120
 |
 |

PITNEY BOWES INC.
NOTES TO CONSOLIDATED FINANCIAL STATEMENTS
(Tabular dollars in thousands, except per share data)
55
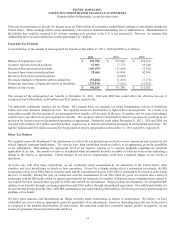
The Board of Directors determines the dividend rate, terms of redemption, terms of conversion (if any) and other pertinent features of
future issuances of preferred and preference stock. Cash dividends paid on common stock were $1.48 per share, $1.46 per share and
$1.44 per share for 2011, 2010, and 2009, respectively. At December 31, 2011, 38,565,913 shares of common stock were reserved for
issuance under our dividend reinvestment and other corporate plans.
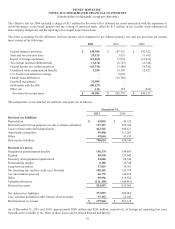
Accumulated Other Comprehensive Loss
The components of accumulated other comprehensive loss are as follow:
2011 2010 2009
Foreign currency translation adjustments $ 83,952 $ 137,521 $ 153,206
Net unrealized loss on derivatives (8,438) (10,445) (11,738)
Net unrealized gain on investment securities 4,387 1,439 649
Net unamortized loss on pension and postretirement plans (741,546) (602,321) (601,909)
Accumulated other comprehensive loss $ (661,645) $ (473,806) $ (459,792)
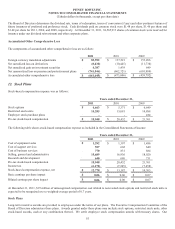
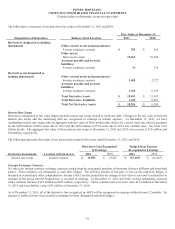
12. Stock Plans
Stock-based compensation expense was as follows:
Years ended December 31,
2011 2010 2009
Stock options $ 4,663 $ 5,371 $ 6,649
Restricted stock units 14,285 15,081 14,888
Employee stock purchase plans - - 224
Pre-tax stock-based compensation $ 18,948 $ 20,452 $ 21,761
The following table shows stock-based compensation expense as included in the Consolidated Statements of Income:
Years ended December 31,
2011 2010 2009
Cost of equipment sales $ 1,292 $ 1,397 $ 1,486
Cost of support services 557 602 640
Cost of business services 770 831 884
Selling, general and administrative 15,689 16,936 18,020
Research and development 640 686 731
Pre-tax stock-based compensation 18,948 20,452 21,761
Income tax (6,170) (7,265) (7,458)
Stock-based compensation expense, net $ 12,778 $ 13,187 $ 14,303
Basic earnings per share impact $ 0.06 $ 0.06 $ 0.07
Diluted earnings per share impact $ 0.06 $ 0.06 $ 0.07
At December 31, 2011, $19 million of unrecognized compensation cost related to non-vested stock options and restricted stock units is
expected to be recognized over a weighted-average period of 0.7 years.
Stock Plans
Long-term incentive awards are provided to employees under the terms of our plans. The Executive Compensation Committee of the
Board of Directors administers these plans. Awards granted under these plans may include stock options, restricted stock units, other
stock-based awards, cash or any combination thereof. We settle employee stock compensation awards with treasury shares. Our