Pitney Bowes 2011 Annual Report Download - page 93
Download and view the complete annual report
Please find page 93 of the 2011 Pitney Bowes annual report below. You can navigate through the pages in the report by either clicking on the pages listed below, or by using the keyword search tool below to find specific information within the annual report.-
 1
1 -
2
-
3
-
4
-
5
-
6
-
7
-
8
-
9
-
10
-
11
-
12
-
13
-
14
-
15
-
16
-
17
-
18
-
19
-
20
-
21
-
22
-
23
-
24
-
25
-
26
-
27
-
28
-
29
-
30
-
31
-
32
-
33
-
34
-
35
-
36
-
37
-
38
-
39
-
40
-
41
-
42
-
43
-
44
-
45
-
46
-
47
-
48
-
49
-
50
-
51
-
52
-
53
-
54
-
55
-
56
-
57
-
58
-
59
-
60
-
61
-
62
-
63
-
64
-
65
-
66
-
67
-
68
-
69
-
70
-
71
-
72
-
73
-
74
-
75
-
76
-
77
-
78
-
79
-
80
-
81
-
82
-
 83
83 -
 84
84 -
 85
85 -
 86
86 -
 87
87 -
 88
88 -
 89
89 -
 90
90 -
 91
91 -
 92
92 -
 93
93 -
 94
94 -
 95
95 -
 96
96 -
 97
97 -
 98
98 -
 99
99 -
 100
100 -
 101
101 -
 102
102 -
 103
103 -
104
-
105
-
106
-
107
-
108
-
109
-
110
-
111
-
112
-
113
-
114
-
115
-
116
-
117
-
118
-
119
-
120
 |
 |

PITNEY BOWES INC.
NOTES TO CONSOLIDATED FINANCIAL STATEMENTS
(Tabular dollars in thousands, except per share data)
75
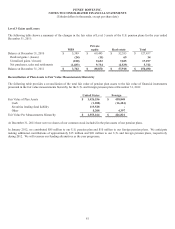
Pre-tax amounts recognized in AOCI consist of:
United States Foreign
2011 2010 2011 2010
Net actuarial loss $ 858,531 $ 719,890 $ 224,731 $ 168,376
Prior service cost 2,159 2,400 541 541
Transition asset - - (273) (282)
Total $ 860,690 $ 722,290 $ 224,999 $ 168,635
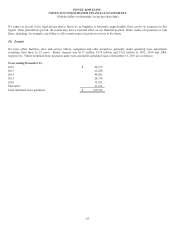
The estimated amounts that will be amortized from AOCI into net periodic benefits cost in 2012 are as follows:
Net actuarial loss $ 53,256 $ 13,700
Prior service cost 816 99
Transition asset - (9)
Total $ 54,072 $ 13,790
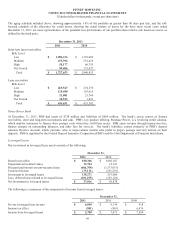
The components of net periodic pension cost for defined benefit pension plans are as follows:
United States Foreign
2011 2010 2009 2011 2010 2009
Service cost $ 19,450 $ 23,157 $ 24,274 $ 7,310 $ 6,907 $ 6,853
Interest cost 87,738 89,602 93,997 28,329 27,507 25,200
Expected return on
plan assets (123,058) (123,095) (120,662)
(31,784)
(28,838)
(27,193)
Amortization of
transition cost - - - (10) (9) (61)
Amortization of prior
service (cost) credit 147 (2,575) (2,547) 170 214 446
Recognized net
actuarial loss 37,522 32,343 26,063 11,135 10,205 2,486
Special termination
benefits 1,489 8,148 112 277 291 2,385
Settlement / curtailment 3,036 10,712 4,107 274 1,285 202
Net periodic
benefit cost (1) $ 26,324 $ 38,292 $ 25,344 $ 15,701 $ 17,562 $ 10,318
(1) Includes $5 million and $17 million charged to restructuring reserves in 2011 and 2010, respectively. See Note 14 for further
information.
Other changes in plan assets and benefit obligations for defined benefit pension plans recognized in other comprehensive income are
as follows:
United States Foreign
2011 2010 2011 2010
Curtailments effects and settlements $ (95) $ (4,290) $ (274) $ (464)
Net actuarial loss 176,164 13,467 67,934 5,748
Prior service credit - - - (3,790)
Amortization of net actuarial (loss) gain (37,522) (32,343) (11,135) 5,440
Amortization of prior service (cost) credit (147) 2,575 (170) (214)
Net transitional obligation (asset) - - 9 (86)
Total recognized in other
comprehensive income $ 138,400 $ (20,591) $ 56,364 $ 6,634