Pitney Bowes 2011 Annual Report Download - page 16
Download and view the complete annual report
Please find page 16 of the 2011 Pitney Bowes annual report below. You can navigate through the pages in the report by either clicking on the pages listed below, or by using the keyword search tool below to find specific information within the annual report.-
 1
1 -
2
-
3
-
4
-
5
-
 6
6 -
 7
7 -
 8
8 -
 9
9 -
 10
10 -
 11
11 -
 12
12 -
 13
13 -
 14
14 -
 15
15 -
 16
16 -
 17
17 -
 18
18 -
 19
19 -
 20
20 -
 21
21 -
 22
22 -
 23
23 -
 24
24 -
 25
25 -
 26
26 -
27
-
28
-
29
-
30
-
31
-
32
-
33
-
34
-
35
-
36
-
37
-
38
-
39
-
40
-
41
-
42
-
43
-
44
-
45
-
46
-
47
-
48
-
49
-
50
-
51
-
52
-
53
-
54
-
55
-
56
-
57
-
58
-
59
-
60
-
61
-
62
-
63
-
64
-
65
-
66
-
67
-
68
-
69
-
70
-
71
-
72
-
73
-
74
-
75
-
76
-
77
-
78
-
79
-
80
-
81
-
82
-
83
-
84
-
85
-
86
-
87
-
88
-
89
-
90
-
91
-
92
-
93
-
94
-
95
-
96
-
97
-
98
-
99
-
100
-
101
-
102
-
103
-
104
-
105
-
106
-
107
-
108
-
109
-
110
-
111
-
112
-
113
-
114
-
115
-
116
-
117
-
118
-
119
-
120
 |
 |

Pitney Bowes Annual Report 201114
We are pleased that in February our Board of Directors decided to increase our dividend to $0.375 per common
share for the first quarter of 2012. This marks the 30th consecutive year that we have increased our quarterly dividend.
This is an important part of our commitment to provide excellent returns to shareholders.
We are expanding our opportunities for growing our value to shareholders and customers, as we successfully transform
our ability to help our customers communicate and build lasting relationships with their customers. Our Strategic
Transformation program has created the capacity to support and accelerate growth. We are focused on improving
revenue trends in 2012 and have a number of initiatives designed to take advantage of opportunities to grow our digital
and hybrid capabilities and offerings, while continuing to enrich our value proposition for all our customers.
Michael Monahan
Executive Vice President
and Chief Financial Officer
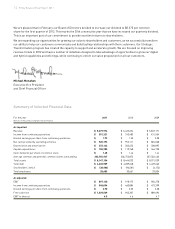
Summary of Selected Financial Data
For the year 2011 2010 2009
(Dollars in thousands, except per share amounts)
As reported
Revenue $ 5,277,974 $ 5,425,254 $ 5,569,171
Income from continuing operations $ 351,321 $ 310,483 $ 431,554
Diluted earnings per share from continuing operations $ 1.73 $ 1.50 $ 2.08
Net cash provided by operating activities $ 920,193 $ 952,111 $ 824,068
Depreciation and amortization $ 272,142 $ 303,653 $ 338,895
Capital expenditures $ 155,980 $ 119,768 $ 166,728
Cash dividends per share of common stock $ 1.48 $ 1.46 $ 1.44
Average common and potential common shares outstanding 202,765,947 206,752,872 207,322,440
Total assets $ 8,147,104 $ 8,444,023 $ 8,571,039
Total debt $ 4,233,909 $ 4,289,248 $ 4,439,662
Stockholders’ deficit $ (38,986) $ (96,581) $ (3,152)
Total employees 28,683 30,661 33,004
As adjusted
EBIT $ 897,130 $ 918,175 $ 950,278
Income from continuing operations $ 548,094 $ 460,884 $ 473,399
Diluted earnings per share from continuing operations $ 2.70 $ 2.23 $ 2.28
Free cash flow $ 1,029,569 $ 962,307 $ 889,094
EBIT to interest 4.5 4.6 4.7