Pitney Bowes 2011 Annual Report Download - page 75
Download and view the complete annual report
Please find page 75 of the 2011 Pitney Bowes annual report below. You can navigate through the pages in the report by either clicking on the pages listed below, or by using the keyword search tool below to find specific information within the annual report.-
 1
1 -
2
-
3
-
4
-
5
-
6
-
7
-
8
-
9
-
10
-
11
-
12
-
13
-
14
-
15
-
16
-
17
-
18
-
19
-
20
-
21
-
22
-
23
-
24
-
25
-
26
-
27
-
28
-
29
-
30
-
31
-
32
-
33
-
34
-
35
-
36
-
37
-
38
-
39
-
40
-
41
-
42
-
43
-
44
-
45
-
46
-
47
-
48
-
49
-
50
-
51
-
52
-
53
-
54
-
55
-
56
-
57
-
58
-
59
-
60
-
61
-
62
-
63
-
64
-
 65
65 -
 66
66 -
 67
67 -
 68
68 -
 69
69 -
 70
70 -
 71
71 -
 72
72 -
 73
73 -
 74
74 -
 75
75 -
 76
76 -
 77
77 -
 78
78 -
 79
79 -
 80
80 -
 81
81 -
 82
82 -
 83
83 -
 84
84 -
 85
85 -
86
-
87
-
88
-
89
-
90
-
91
-
92
-
93
-
94
-
95
-
96
-
97
-
98
-
99
-
100
-
101
-
102
-
103
-
104
-
105
-
106
-
107
-
108
-
109
-
110
-
111
-
112
-
113
-
114
-
115
-
116
-
117
-
118
-
119
-
120
 |
 |

PITNEY BOWES INC.
NOTES TO CONSOLIDATED FINANCIAL STATEMENTS
(Tabular dollars in thousands, except per share data)
57
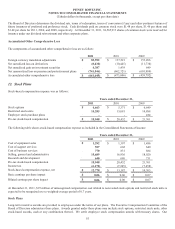
The fair value of stock options granted and related assumptions are as follows:
Years ended December 31,
2011 2010 2009
Expected dividend yield 6.1% 6.1% 4.5%
Expected stock price volatility 26.1% 25.6% 21.4%
Risk-free interest rate 3.3% 3.2% 2.4%
Expected life – years 7.4 7.3 7.5
Weighted-average fair value per option granted $3.45 $2.82 $3.04
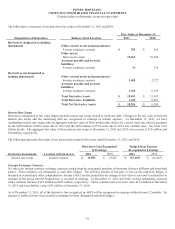
Restricted Stock Units
Restricted stock units are granted to employees and entitle the holder to shares of common stock as the units vest, typically over a four
year service period. The fair value of the units is determined on the grant date based on our stock price at that date less the present
value of expected dividends. The following table summarizes information about restricted stock units during 2011:
Units / Shares
Weighted-average
grant date fair value
Restricted stock units outstanding at December 31, 2010 1,637,242 $25.55
Granted 662,049 $22.44
Vested (543,688) $26.89
Forfeited (126,548) $23.12
Restricted stock units outstanding at December 31, 2011 1,629,055 $22.33
The intrinsic value of restricted stock units outstanding at December 31, 2011 was $30 million. The intrinsic value of restricted stock
units vested during 2011, 2010 and 2009 was $13 million, $9 million and $5 million, respectively.
Employee Stock Purchase Plans (ESPP)
Substantially all U.S. and Canadian employees can purchase shares of our common stock at an offering price of 95% of the average
price of our common stock on the New York Stock Exchange on the offering date. At no time will the exercise price be less than the
lowest price permitted under Section 423 of the Internal Revenue Code. We may grant rights to purchase up to 5,108,794 common
shares under the ESPP. We granted rights to purchase 258,667 shares, 318,556 shares and 540,660 shares in 2011, 2010 and 2009,
respectively.
Directors’ Stock Plan
Under this plan, each non-employee director is granted 2,200 shares of restricted common stock annually. The shares carry full voting
and dividend rights but, except as provided herein, may not be transferred or alienated until the later of (1) termination of service as a
director, or, if earlier, the date of a change of control, or (2) the expiration of the six-month period following the grant of such shares.
If a director terminates service as a director prior to the expiration of the six-month period following a grant of restricted stock, that
award will be forfeited. The Directors’ Stock Plan permits certain limited dispositions of restricted common stock to family members,
family trusts or partnerships, as well as donations to charity after the expiration of the six-month holding period, provided the director
retains a minimum of 7,500 shares of restricted common stock. We granted 22,000 shares to non-employee directors in 2011, and
26,400 shares in 2010 and 2009. Compensation expense, net of taxes, was less than $1 million in each of the years ended December
31, 2011, 2010 and 2009.