Pitney Bowes 2011 Annual Report Download - page 54
Download and view the complete annual report
Please find page 54 of the 2011 Pitney Bowes annual report below. You can navigate through the pages in the report by either clicking on the pages listed below, or by using the keyword search tool below to find specific information within the annual report.-
 1
1 -
2
-
3
-
4
-
5
-
6
-
7
-
8
-
9
-
10
-
11
-
12
-
13
-
14
-
15
-
16
-
17
-
18
-
19
-
20
-
21
-
22
-
23
-
24
-
25
-
26
-
27
-
28
-
29
-
30
-
31
-
32
-
33
-
34
-
35
-
36
-
37
-
38
-
39
-
40
-
41
-
42
-
43
-
 44
44 -
 45
45 -
 46
46 -
 47
47 -
 48
48 -
 49
49 -
 50
50 -
 51
51 -
 52
52 -
 53
53 -
 54
54 -
 55
55 -
 56
56 -
 57
57 -
 58
58 -
 59
59 -
 60
60 -
 61
61 -
 62
62 -
 63
63 -
 64
64 -
65
-
66
-
67
-
68
-
69
-
70
-
71
-
72
-
73
-
74
-
75
-
76
-
77
-
78
-
79
-
80
-
81
-
82
-
83
-
84
-
85
-
86
-
87
-
88
-
89
-
90
-
91
-
92
-
93
-
94
-
95
-
96
-
97
-
98
-
99
-
100
-
101
-
102
-
103
-
104
-
105
-
106
-
107
-
108
-
109
-
110
-
111
-
112
-
113
-
114
-
115
-
116
-
117
-
118
-
119
-
120
 |
 |

36
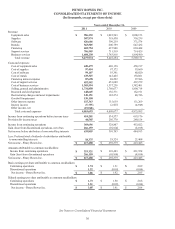
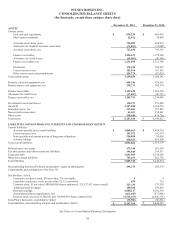
PITNEY BOWES INC.
CONSOLIDATED STATEMENTS OF INCOME
(In thousands, except per share data)
Years ended December 31,
2011 2010 2009
Revenue:
Equipment sales $ 986,392 $ 1,022,563 $ 1,000,153
Supplies 307,974 318,430 336,239
Software 426,606 390,219 371,574
Rentals 563,505 600,759 647,432
Financing 602,754 637,948 694,444
Support services 706,505 711,519 714,429
Business services 1,684,238 1,743,816 1,804,900
Total revenue 5,277,974 5,425,254 5,569,171
Costs and expenses:
Cost of equipment sales 449,479 469,158 450,197
Cost of supplies 97,454 97,172 93,660
Cost of software 99,107 93,391 88,020
Cost of rentals 125,325 141,465 158,881
Financing interest expense 87,698 88,292 97,586
Cost of support services 452,582 451,609 467,279
Cost of business services 1,303,594 1,337,236 1,382,401
Selling, general and administrative 1,731,858 1,760,677 1,800,714
Research and development 148,645 156,371 182,191
Restructuring charges and asset impairments 148,151 182,274 48,746
Goodwill impairment 130,150 - -
Other interest expense 115,363 115,619 111,269
Interest income (5,795) (2,587) (4,949)
Other income, net (19,918) - -
Total costs and expenses 4,863,693 4,890,677 4,875,995
Income from continuing operations before income taxes 414,281 534,577 693,176
Provision for income taxes 44,585 205,770 240,154
Income from continuing operations 369,696 328,807 453,022
Gain (loss) from discontinued operations, net of tax 266,159 (18,104) (8,109)
Net income before attribution of noncontrolling interests 635,855 310,703 444,913
Less: Preferred stock dividends of subsidiaries attributable
to noncontrolling interests 18,375 18,324 21,468
Net income - Pitney Bowes Inc. $ 617,480 $ 292,379 $ 423,445
Amounts attributable to common stockholders:
Income from continuing operations $ 351,321 $ 310,483 $ 431,554
Gain (loss) from discontinued operations 266,159 (18,104) (8,109)
Net income - Pitney Bowes Inc. $ 617,480 $ 292,379 $ 423,445
Basic earnings per share attributable to common stockholders:
Continuing operations $ 1.74 $ 1.51 $ 2.09
Discontinued operations 1.32 (0.09) (0.04)
Net income - Pitney Bowes Inc. $ 3.06 $ 1.42 $ 2.05
Diluted earnings per share attributable to common stockholders:
Continuing operations $ 1.73 $ 1.50 $ 2.08
Discontinued operations 1.31 (0.09) (0.04)
Net income - Pitney Bowes Inc. $ 3.05 $ 1.41 $ 2.04
See Notes to Consolidated Financial Statements