Pitney Bowes 2011 Annual Report Download - page 33
Download and view the complete annual report
Please find page 33 of the 2011 Pitney Bowes annual report below. You can navigate through the pages in the report by either clicking on the pages listed below, or by using the keyword search tool below to find specific information within the annual report.-
 1
1 -
2
-
3
-
4
-
5
-
6
-
7
-
8
-
9
-
10
-
11
-
12
-
13
-
14
-
15
-
16
-
17
-
18
-
19
-
20
-
21
-
22
-
 23
23 -
 24
24 -
 25
25 -
 26
26 -
 27
27 -
 28
28 -
 29
29 -
 30
30 -
 31
31 -
 32
32 -
 33
33 -
 34
34 -
 35
35 -
 36
36 -
 37
37 -
 38
38 -
 39
39 -
 40
40 -
 41
41 -
 42
42 -
 43
43 -
44
-
45
-
46
-
47
-
48
-
49
-
50
-
51
-
52
-
53
-
54
-
55
-
56
-
57
-
58
-
59
-
60
-
61
-
62
-
63
-
64
-
65
-
66
-
67
-
68
-
69
-
70
-
71
-
72
-
73
-
74
-
75
-
76
-
77
-
78
-
79
-
80
-
81
-
82
-
83
-
84
-
85
-
86
-
87
-
88
-
89
-
90
-
91
-
92
-
93
-
94
-
95
-
96
-
97
-
98
-
99
-
100
-
101
-
102
-
103
-
104
-
105
-
106
-
107
-
108
-
109
-
110
-
111
-
112
-
113
-
114
-
115
-
116
-
117
-
118
-
119
-
120
 |
 |

15
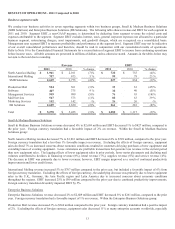
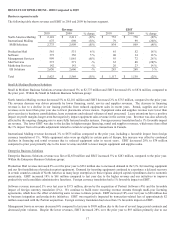
Supplies
Supplies revenue decreased 3% to $308 million compared to the prior year due to reduced mail volumes and fewer installed meters
worldwide. Foreign currency translation had a 2% favorable impact. Cost of supplies as a percentage of revenue was 31.6%
compared with 30.5% in the prior year primarily due to the mix of lower margin supply sales worldwide.
Software
Software revenue increased 9% to $427 million compared to the prior year, with prior year acquisitions and foreign currency
translation each contributing 3% of the increase. The remaining underlying increase of 3% was due to higher licensing revenue. Cost
of software as a percentage of revenue improved to 23.2% compared with 23.9% in the prior year due to the increase in high margin
licensing revenue.
Rentals
Rentals revenue decreased 6% to $564 million compared to the prior year as customers in the U.S. continue to downsize to smaller,
fully featured machines and fewer installed meters worldwide. Foreign currency translation had a 1% positive impact. Cost of rentals
as a percentage of revenue improved to 22.2% compared with 23.6% in the prior year primarily due to lower depreciation associated
with higher levels of lease extensions.
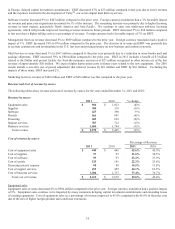
Financing
Financing revenue decreased 6% to $603 million compared to the prior year due to lower equipment sales in prior periods. Foreign
currency translation had a 1% positive impact. Financing interest expense as a percentage of revenue was 14.5% compared with
13.8% in the prior year due to higher overall effective interest rates. In computing financing interest expense, which represents the
cost of borrowing associated with the generation of financing revenues, we assume a 10:1 leveraging ratio of debt to equity and apply
our overall effective interest rate to the average outstanding finance receivables.
Support Services
Support services revenue decreased 1% to $707 million compared to the prior year driven by lower new equipment placements
worldwide. Foreign currency translation had a positive impact of 2%. Cost of support services as a percentage of revenue increased
to 64.1% compared with 63.5% in the prior year primarily due to due to an increase in installations of high-end integrated mailing
systems.
Business Services
Business services revenue decreased 3% to $1,684 million compared to the prior year primarily due to the loss of several large
contracts in 2010. Foreign currency translation had a 1% favorable impact. Cost of business services as a percentage of revenue
increased to 77.4% compared with 76.7% in the prior year primarily due to lower revenues, higher shipping costs in the International
Mail Services operations, and pricing pressure on new business and contract renewals.
Selling, general and administrative (SG&A)
SG&A expenses decreased $29 million; however, excluding the impacts of foreign currency translation and prior year acquisitions,
SG&A expenses decreased $72 million, or 4% primarily due to process improvements and cost saving initiatives. As a percentage of
revenue, SG&A expenses were 32.8% compared to 32.5% in the prior year.
Research and development
Research and development expenses decreased $8 million, or 5% from the prior year due to lower cost of offshore development, cost
reduction initiatives and a reduction in development work for Connect+TM.
Goodwill and intangible asset impairment
Aggregate goodwill and intangible asset impairment charges were $130 million and $17 million, respectively. The intangible asset
impairment charges are included in restructuring charges and asset impairments in the Consolidated Statements of Income. See
Critical Accounting Estimates in this MD&A and Note 1 to the Consolidated Financial Statements for further details.
Other income, net
Other income, net of $20 million reflects the $27 million of insurance reimbursements recognized in other income in connection with
claims associated with the fire at the Dallas presort mail facility and a pre-tax loss of $7 million on the sale of non-U.S. leveraged
lease assets.
Income taxes / effective tax rate
The effective tax rates for 2011 and 2010 were 10.8% and 38.5%, respectively. The effective tax rate for 2011 includes $90 million of
tax benefits arising from the IRS tax settlements, a $34 million tax benefit from the aforementioned sale of non-U.S. leveraged lease
assets and a $4 million charge from the write-off of deferred tax assets associated with the expiration of out-of-the-money vested stock