Pep Boys 2013 Annual Report Download - page 99
Download and view the complete annual report
Please find page 99 of the 2013 Pep Boys annual report below. You can navigate through the pages in the report by either clicking on the pages listed below, or by using the keyword search tool below to find specific information within the annual report.-
 1
1 -
2
-
3
-
4
-
5
-
6
-
7
-
8
-
9
-
10
-
11
-
12
-
13
-
14
-
15
-
16
-
17
-
18
-
19
-
20
-
21
-
22
-
23
-
24
-
25
-
26
-
27
-
28
-
29
-
30
-
31
-
32
-
33
-
34
-
35
-
36
-
37
-
38
-
39
-
40
-
41
-
42
-
43
-
44
-
45
-
46
-
47
-
48
-
49
-
50
-
51
-
52
-
53
-
54
-
55
-
56
-
57
-
58
-
59
-
60
-
61
-
62
-
63
-
64
-
65
-
66
-
67
-
68
-
69
-
70
-
71
-
72
-
73
-
74
-
75
-
76
-
77
-
78
-
79
-
80
-
81
-
82
-
83
-
84
-
85
-
86
-
87
-
88
-
 89
89 -
 90
90 -
 91
91 -
 92
92 -
 93
93 -
 94
94 -
 95
95 -
 96
96 -
 97
97 -
 98
98 -
 99
99 -
 100
100 -
 101
101 -
 102
102 -
 103
103 -
 104
104 -
 105
105 -
 106
106 -
 107
107 -
 108
108 -
 109
109 -
110
-
111
-
112
-
113
-
114
-
115
-
116
-
117
-
118
-
119
-
120
-
121
-
122
-
123
-
124
-
125
-
126
-
127
-
128
-
129
-
130
-
131
-
132
-
133
-
134
-
135
-
136
-
137
-
138
-
139
-
140
-
141
-
142
-
143
-
144
-
145
-
146
-
147
-
148
-
149
-
150
-
151
-
152
-
153
-
154
-
155
-
156
-
157
-
158
-
159
-
160
-
161
-
162
-
163
-
164
 |
 |
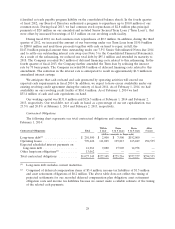
obligations. Cash flows realized through the sale of automotive services, tires, parts and accessories are
our primary source of liquidity. Net cash provided by operating activities was $59.4 million in fiscal
2013, as compared to $88.5 million in the prior year. The $29.1 million decrease was due to an
unfavorable change in operating assets and liabilities of $13.8 million and a decrease in net earnings,
net of non-cash adjustments of $15.5 million. The change in operating assets and liabilities was
primarily due to unfavorable changes in accrued expenses and other current assets of $10.3 million and
other long-term liabilities of $6.8 million, partially offset by a favorable change in inventory, net of
accounts payable, of $3.3 million. The decline in net earnings, net of non-cash adjustments, was
primarily due to $42.8 million of merger termination fees recorded in the second quarter of 2012,
partially offset by $11.2 million of refinancing costs and the $17.8 million pension settlement charge
recorded in the third and fourth quarter of 2012, respectively.
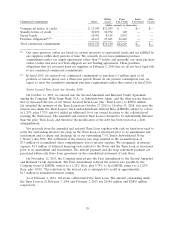
The unfavorable change in accrued expenses and other current assets was primarily due to a
decrease in employee payroll and related benefit accruals of $8.4 million due to the timing of payments
to employees and taxing authorities.
Taking into consideration changes in our trade payable program liability (shown as cash flows from
financing activities on the consolidated statements of cash flows), cash used in accounts payable was
$11.5 million in fiscal 2013 as compared to cash generated from accounts payable of $65.5 million for
fiscal 2012. The ratio of accounts payable, including our trade payable program, to inventory was 57.4%
at February 1, 2014 and 61.5% at February 2, 2013. The $31.1 million increase in inventory from
February 2, 2013 was primarily due to investment in our new stores, strategic initiatives like our speed
shops and Superhub concepts, and new product offerings.
Cash used in investing activities was $65.3 million in fiscal 2013 as compared to $52.8 million in
the prior year period. Capital expenditures, including the acquisition of 18 Service and Tire Centers in
Southern California for $10.7 million, were $64.7 million for fiscal 2013. Our fiscal 2013 capital
expenditures also include the addition of 29 new locations, the conversion of 11 Supercenters into
Superhubs, the addition of 63 Speed Shops within existing Supercenters and required expenditures for
existing stores, offices and distribution centers. Capital expenditures for fiscal 2012 of $54.7 million
included the addition of 20 Service & Tire Centers, six Supercenters, the conversion of seven
Supercenters into Superhubs, the addition of 17 Speed Shops within existing Supercenters, and
information technology enhancements including our eCommerce initiatives and parts catalog
enhancements. In fiscal 2012, we sold our regional administrative office in Los Angeles, CA for
approximately $5.6 million, net of closing costs. In addition, during fiscal 2013 and fiscal 2012 we
invested, net of funds released, $0.7 million and $3.7 million, respectively, in a restricted account as
collateral for retained liabilities included within existing insurance programs in lieu of previously
outstanding letters of credit.
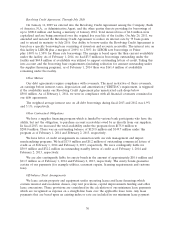
Our targeted capital expenditures for fiscal 2014 are $80.0 million, which includes the planned
addition of 30 Service & Tire Centers, three Supercenters, the addition of 25 speed shops within
existing Supercenters, and the conversion of 41 stores to the new ‘‘Road Ahead’’ format. These
expenditures are expected to be funded from cash on hand and net cash generated from operating
activities. Additional capacity, if needed, exists under our existing line of credit.
Cash used in financing activities was $19.8 million and $34.8 million in fiscal 2013 and 2012,
respectively. The cash used in financing activities in fiscal 2013 was primarily related to net payments
under our trade payable program of $19.9 million as compared to net borrowings of $64.5 million in
the corresponding period of the prior year. The trade payable program is funded by various bank
participants who have the ability, but not the obligation, to purchase, directly from our suppliers,
account receivables owed by Pep Boys. In the second quarter of 2013, we increased the availability
under our trade payable program from $175.0 million to $200.0 million. As of February 1, 2014 and
February 2, 2013, we had an outstanding balance of $129.8 million and $149.7 million, respectively
27