Pep Boys 2013 Annual Report Download - page 90
Download and view the complete annual report
Please find page 90 of the 2013 Pep Boys annual report below. You can navigate through the pages in the report by either clicking on the pages listed below, or by using the keyword search tool below to find specific information within the annual report.-
 1
1 -
2
-
3
-
4
-
5
-
6
-
7
-
8
-
9
-
10
-
11
-
12
-
13
-
14
-
15
-
16
-
17
-
18
-
19
-
20
-
21
-
22
-
23
-
24
-
25
-
26
-
27
-
28
-
29
-
30
-
31
-
32
-
33
-
34
-
35
-
36
-
37
-
38
-
39
-
40
-
41
-
42
-
43
-
44
-
45
-
46
-
47
-
48
-
49
-
50
-
51
-
52
-
53
-
54
-
55
-
56
-
57
-
58
-
59
-
60
-
61
-
62
-
63
-
64
-
65
-
66
-
67
-
68
-
69
-
70
-
71
-
72
-
73
-
74
-
75
-
76
-
77
-
78
-
79
-
 80
80 -
 81
81 -
 82
82 -
 83
83 -
 84
84 -
 85
85 -
 86
86 -
 87
87 -
 88
88 -
 89
89 -
 90
90 -
 91
91 -
 92
92 -
 93
93 -
 94
94 -
 95
95 -
 96
96 -
 97
97 -
 98
98 -
 99
99 -
 100
100 -
101
-
102
-
103
-
104
-
105
-
106
-
107
-
108
-
109
-
110
-
111
-
112
-
113
-
114
-
115
-
116
-
117
-
118
-
119
-
120
-
121
-
122
-
123
-
124
-
125
-
126
-
127
-
128
-
129
-
130
-
131
-
132
-
133
-
134
-
135
-
136
-
137
-
138
-
139
-
140
-
141
-
142
-
143
-
144
-
145
-
146
-
147
-
148
-
149
-
150
-
151
-
152
-
153
-
154
-
155
-
156
-
157
-
158
-
159
-
160
-
161
-
162
-
163
-
164
 |
 |

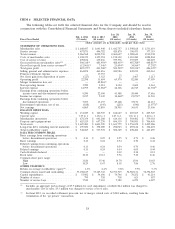
ITEM 6 SELECTED FINANCIAL DATA
The following tables set forth the selected financial data for the Company and should be read in
conjunction with the Consolidated Financial Statements and Notes thereto included elsewhere herein.
Jan. 28, Jan. 29, Jan. 30,
Feb. 1, 2014 Feb. 2, 2013 2012 2011 2010
Fiscal Year Ended (52 weeks) (53 weeks) (52 weeks) (52 weeks) (52 weeks)
(dollar amounts are in thousands, except per share data)
STATEMENT OF OPERATIONS DATA
Merchandise sales .................... $1,608,697 $ 1,643,948 $ 1,642,757 $ 1,598,168 $ 1,533,619
Service revenue ...................... 457,871 446,782 420,870 390,473 377,319
Total revenues ....................... 2,066,568 2,090,730 2,063,627 1,988,641 1,910,938
Costs of merchandise sales .............. 1,108,359 1,159,994 1,154,322 1,110,380 1,084,804
Cost of service revenue ................. 470,832 439,236 399,776 355,909 340,027
Gross profit from merchandise sales(10) ...... 500,338(1) 483,954(3) 488,435(5) 487,788(7) 448,815(8)
Gross (loss) profit from service revenue(10) .... (12,961)(1) 7,546(3) 21,094(5) 34,564(7) 37,292(8)
Total gross profit ..................... 487,377(1) 491,500(3) 509,529(5) 522,352(7) 486,107(8)
Selling, general and administrative expenses . . . 464,852 463,416 443,986 442,239 430,261
Pension settlement expense .............. — 17,753 — — —
Net (loss) gain from disposition of assets ..... (227) 1,323 27 2,467 1,213
Operating profit ..................... 22,298 11,654 65,570 82,580 57,059
Merger termination fees, net ............. — 42,816(2) ———
Non-operating income ................. 1,789 2,012 2,324 2,609 2,261
Interest expense ..................... 14,797 33,982(4) 26,306 26,745 21,704(9)
Earnings from continuing operations before
income taxes and discontinued operations . . . 9,290 22,500 41,588 58,444 37,616
Income tax expense ................... 2,237 9,345 12,460(6) 21,273(6) 13,503
Earnings from continuing operations before
discontinued operations ............... 7,053 13,155 29,128 37,171 24,113
Discontinued operations, net of tax ......... (188) (345) (225) (540) (1,077)(8)
Net earnings ........................ 6,865 12,810 28,903 36,631 23,036
BALANCE SHEET DATA
Working capital ...................... $ 131,029 $ 126,505 $ 166,627 $ 203,367 $ 205,525
Current ratio ....................... 1.19 to 1 1.18 to 1 1.27 to 1 1.36 to 1 1.40 to 1
Merchandise inventories ................ $ 672,354 $ 641,208 $ 614,136 $ 564,402 $ 559,118
Property and equipment-net .............. $ 625,525 $ 657,270 $ 696,339 $ 700,981 $ 706,450
Total assets ......................... $1,605,481 $ 1,603,949 $ 1,633,779 $ 1,556,672 $ 1,499,086
Long-term debt, excluding current maturities . . $ 199,500 $ 198,000 $ 294,043 $ 295,122 $ 306,201
Total stockholders’ equity ............... $ 548,065 $ 537,572 $ 504,329 $ 478,460 $ 443,295
DATA PER COMMON SHARE
Basic earnings from continuing operations
before discontinued operations .......... $ 0.13 $ 0.25 $ 0.55 $ 0.71 $ 0.46
Basic earnings ....................... 0.13 0.24 0.54 0.70 0.44
Diluted earnings from continuing operations
before discontinued operations .......... 0.13 0.24 0.54 0.70 0.46
Diluted earnings ..................... 0.13 0.24 0.54 0.69 0.44
Cash dividends declared ................ — — 0.12 0.12 0.12
Book value ......................... 10.30 10.12 9.56 9.10 8.46
Common share price range:
High ........................... 13.86 15.46 14.70 15.96 10.83
Low............................ 10.29 8.67 8.18 7.86 2.76
OTHER STATISTICS
Return on average stockholders’ equity(11) ..... 1.3% 2.4% 5.8% 7.9% 5.3%
Common shares issued and outstanding ...... 53,198,169 53,125,743 52,753,719 52,585,131 52,392,967
Capital expenditures ................... $ 53,982 $ 54,696 $ 74,746 $ 70,252 $ 43,214
Number of stores ..................... 799 758 738 621 587
Number of service bays ................. 7,520 7,303 7,182 6,259 6,027
(1) Includes an aggregate pretax charge of $7.7 million for asset impairment, of which $2.4 million was charged to
merchandise cost of sales, $5.3 million was charged to service cost of sales.
(2) In fiscal 2012, we recorded settlement proceeds, net of merger related costs of $42.8 million, resulting from the
termination of the ‘‘go private’’ transaction.
18