Pep Boys 2013 Annual Report Download - page 92
Download and view the complete annual report
Please find page 92 of the 2013 Pep Boys annual report below. You can navigate through the pages in the report by either clicking on the pages listed below, or by using the keyword search tool below to find specific information within the annual report.-
 1
1 -
2
-
3
-
4
-
5
-
6
-
7
-
8
-
9
-
10
-
11
-
12
-
13
-
14
-
15
-
16
-
17
-
18
-
19
-
20
-
21
-
22
-
23
-
24
-
25
-
26
-
27
-
28
-
29
-
30
-
31
-
32
-
33
-
34
-
35
-
36
-
37
-
38
-
39
-
40
-
41
-
42
-
43
-
44
-
45
-
46
-
47
-
48
-
49
-
50
-
51
-
52
-
53
-
54
-
55
-
56
-
57
-
58
-
59
-
60
-
61
-
62
-
63
-
64
-
65
-
66
-
67
-
68
-
69
-
70
-
71
-
72
-
73
-
74
-
75
-
76
-
77
-
78
-
79
-
80
-
81
-
 82
82 -
 83
83 -
 84
84 -
 85
85 -
 86
86 -
 87
87 -
 88
88 -
 89
89 -
 90
90 -
 91
91 -
 92
92 -
 93
93 -
 94
94 -
 95
95 -
 96
96 -
 97
97 -
 98
98 -
 99
99 -
 100
100 -
 101
101 -
 102
102 -
103
-
104
-
105
-
106
-
107
-
108
-
109
-
110
-
111
-
112
-
113
-
114
-
115
-
116
-
117
-
118
-
119
-
120
-
121
-
122
-
123
-
124
-
125
-
126
-
127
-
128
-
129
-
130
-
131
-
132
-
133
-
134
-
135
-
136
-
137
-
138
-
139
-
140
-
141
-
142
-
143
-
144
-
145
-
146
-
147
-
148
-
149
-
150
-
151
-
152
-
153
-
154
-
155
-
156
-
157
-
158
-
159
-
160
-
161
-
162
-
163
-
164
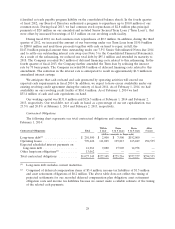
 |
 |
also have a commercial sales program that delivers parts, tires and equipment to automotive repair
shops and dealers. Service & Tire Centers, which average approximately 5,000 square feet, provide
DIFM services in neighborhood locations that are conveniently located where our customers live or
work. Service & Tire Centers are designed to capture market share and leverage our existing
Supercenters and support infrastructure. We also operate a handful of legacy DIY only Pep Express
stores.
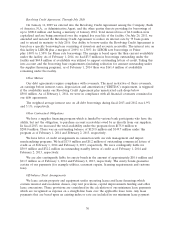
In fiscal 2013, we opened or acquired 40 new Service & Tire Centers and seven new Supercenters
and converted two Supercenters into Service & Tire Centers. We also closed two Service & Tire
Centers and four Supercenters. As of February 1, 2014, we operated 568 Supercenters, 225 Service &
Tire Centers and six Pep Express stores located in 35 states and Puerto Rico.
EXECUTIVE SUMMARY
Net earnings for fiscal 2013 were $6.9 million, or $0.13 per share, as compared to $12.8 million, or
$0.24 per share, reported for fiscal 2012. Excluding certain unusual items, the year over year
profitability remained relatively flat as a decrease in total gross profit (due to 52 weeks of sales in fiscal
2013 versus 53 weeks in fiscal 2012) and higher selling, general and administrative expenses were offset
by reduced interest expense.
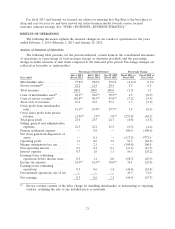
Excluding the fifty-third week in 2012, total revenues increased by 0.6%, or $11.9 million, as
compared to the same period in the prior year due to increased contribution from our non-comparable
store locations partially offset by a 1.3% decline in comparable store sales (sales generated by locations
in operation during the same period of the prior year). This decrease in comparable store sales was
comprised of a 1.6% increase in comparable store service revenue offset by a 2.1% decrease in
comparable store merchandise sales.
We believe that the industry fundamentals of increasing vehicle complexity and customer
preference for DIFM remain solid over the long-term resulting in consistent demand for maintenance
and repair services. Consistent with this long-term trend, we have adopted a long-term strategy of
growing our automotive service business, while maintaining our DIY customer base by offering the
newest and broadest product assortment in the automotive aftermarket.
In the short-term, however, various factors within the economy affect both our customers and our
industry, including the impact of the recent recession, continued high unemployment/underemployment
and the restoration of payroll taxes to previous levels. Another macroeconomic factor affecting our
customers and our industry is gasoline prices. Gasoline prices have not only increased to historical
highs in recent years, but have also experienced significant spikes in prices during each year. We believe
that these gasoline price trends challenge our customer’s spending relative to discretionary and
deferrable purchases. In addition, gasoline prices impact miles driven which, in turn, impact sales of
our services and non-discretionary products. Recently, gasoline prices have been declining which should
increase miles driven. We are encouraged that during calendar year 2013, miles driven, which favorably
impacts sales of our services and non-discretionary products, grew 0.6%. However, given the nature of
these macroeconomic factors, we cannot predict whether or for how long these trends may continue,
nor can we predict to what degree these trends will affect us in the future.
Our primary response to fluctuations in customer demand is to adjust our product assortment,
store staffing and advertising messages. We work continuously to make it easy for customers to choose
us to do it for them and to expand our online efforts to make Pep Boys the most convenient place to
shop for all of their automotive needs. As a result, sales from service appointments made online, tires
purchased on-line and installed in our service bays and products purchased online for store pick up or
home delivery grew 142% in fiscal 2013. In addition, our more focused customer-centered strategy to
ensure that Pep Boys is the best place to shop and care for your car is beginning to take hold. In fiscal
2013, it led to increased customer traffic in our service center line of business. We are optimistic that
our efforts to build long lasting relationships with all of our customers, along with offering solutions for
all of their automotive needs, will yield consistent sales growth in all lines of business.
20