Pep Boys 2013 Annual Report Download - page 145
Download and view the complete annual report
Please find page 145 of the 2013 Pep Boys annual report below. You can navigate through the pages in the report by either clicking on the pages listed below, or by using the keyword search tool below to find specific information within the annual report.-
 1
1 -
2
-
3
-
4
-
5
-
6
-
7
-
8
-
9
-
10
-
11
-
12
-
13
-
14
-
15
-
16
-
17
-
18
-
19
-
20
-
21
-
22
-
23
-
24
-
25
-
26
-
27
-
28
-
29
-
30
-
31
-
32
-
33
-
34
-
35
-
36
-
37
-
38
-
39
-
40
-
41
-
42
-
43
-
44
-
45
-
46
-
47
-
48
-
49
-
50
-
51
-
52
-
53
-
54
-
55
-
56
-
57
-
58
-
59
-
60
-
61
-
62
-
63
-
64
-
65
-
66
-
67
-
68
-
69
-
70
-
71
-
72
-
73
-
74
-
75
-
76
-
77
-
78
-
79
-
80
-
81
-
82
-
83
-
84
-
85
-
86
-
87
-
88
-
89
-
90
-
91
-
92
-
93
-
94
-
95
-
96
-
97
-
98
-
99
-
100
-
101
-
102
-
103
-
104
-
105
-
106
-
107
-
108
-
109
-
110
-
111
-
112
-
113
-
114
-
115
-
116
-
117
-
118
-
119
-
120
-
121
-
122
-
123
-
124
-
125
-
126
-
127
-
128
-
129
-
130
-
131
-
132
-
133
-
134
-
 135
135 -
 136
136 -
 137
137 -
 138
138 -
 139
139 -
 140
140 -
 141
141 -
 142
142 -
 143
143 -
 144
144 -
 145
145 -
 146
146 -
 147
147 -
 148
148 -
 149
149 -
 150
150 -
 151
151 -
 152
152 -
 153
153 -
 154
154 -
 155
155 -
156
-
157
-
158
-
159
-
160
-
161
-
162
-
163
-
164
 |
 |

THE PEP BOYS—MANNY, MOE & JACK AND SUBSIDIARIES
NOTES TO CONSOLIDATED FINANCIAL STATEMENTS (Continued)
Years ended February 1, 2014, February 2, 2013 and January 28, 2012
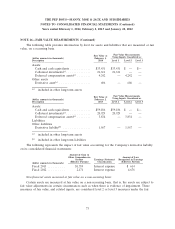
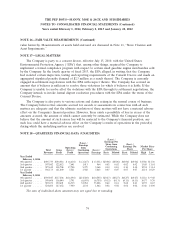
NOTE 16—FAIR VALUE MEASUREMENTS (Continued)
The following table provides information by level for assets and liabilities that are measured at fair
value, on a recurring basis.
Fair Value Measurements
Fair Value at Using Inputs Considered as
(dollar amounts in thousands) February 1,
Description 2014 Level 1 Level 2 Level 3
Assets:
Cash and cash equivalents ............ $33,431 $33,431 $ — $—
Collateral investments(a) .............. 21,611 21,611 — —
Deferred compensation assets(a) ........ 4,242 — 4,242 —
Other assets
Derivative asset(a) .................. 606 — 606 —
(a) included in other long-term assets
Fair Value Measurements
Fair Value at Using Inputs Considered as
(dollar amounts in thousands) February 2,
Description 2013 Level 1 Level 2 Level 3
Assets:
Cash and cash equivalents ............ $59,186 $59,186 $ — $—
Collateral investments(a) .............. 20,929 20,929 — —
Deferred compensation assets(a) ........ 3,834 — 3,834 —
Liabilities:
Other liabilities
Derivative liability(b) ................ 1,567 — 1,567 —
(a) included in other long-term assets
(b) included in other long-term liabilities
The following represents the impact of fair value accounting for the Company’s derivative liability
on its consolidated financial statements:
Amount of Gain in
Other Comprehensive Amount of Loss
Income Earnings Statement Recognized in Earnings
(Effective Portion) Classification (Effective Portion)
(dollar amounts in thousands)
Fiscal 2013 .......... $1,359 Interest expense $ 614
Fiscal 2012 .......... 2,171 Interest expense 4,676
Non-financial assets measured at fair value on a non-recurring basis:
Certain assets are measured at fair value on a non-recurring basis, that is, the assets are subject to
fair value adjustments in certain circumstances such as when there is evidence of impairment. These
measures of fair value, and related inputs, are considered level 2 or level 3 measures under the fair
73