Pep Boys 2013 Annual Report Download - page 31
Download and view the complete annual report
Please find page 31 of the 2013 Pep Boys annual report below. You can navigate through the pages in the report by either clicking on the pages listed below, or by using the keyword search tool below to find specific information within the annual report.-
 1
1 -
2
-
3
-
4
-
5
-
6
-
7
-
8
-
9
-
10
-
11
-
12
-
13
-
14
-
15
-
16
-
17
-
18
-
19
-
20
-
 21
21 -
 22
22 -
 23
23 -
 24
24 -
 25
25 -
 26
26 -
 27
27 -
 28
28 -
 29
29 -
 30
30 -
 31
31 -
 32
32 -
 33
33 -
 34
34 -
 35
35 -
 36
36 -
 37
37 -
 38
38 -
 39
39 -
 40
40 -
 41
41 -
42
-
43
-
44
-
45
-
46
-
47
-
48
-
49
-
50
-
51
-
52
-
53
-
54
-
55
-
56
-
57
-
58
-
59
-
60
-
61
-
62
-
63
-
64
-
65
-
66
-
67
-
68
-
69
-
70
-
71
-
72
-
73
-
74
-
75
-
76
-
77
-
78
-
79
-
80
-
81
-
82
-
83
-
84
-
85
-
86
-
87
-
88
-
89
-
90
-
91
-
92
-
93
-
94
-
95
-
96
-
97
-
98
-
99
-
100
-
101
-
102
-
103
-
104
-
105
-
106
-
107
-
108
-
109
-
110
-
111
-
112
-
113
-
114
-
115
-
116
-
117
-
118
-
119
-
120
-
121
-
122
-
123
-
124
-
125
-
126
-
127
-
128
-
129
-
130
-
131
-
132
-
133
-
134
-
135
-
136
-
137
-
138
-
139
-
140
-
141
-
142
-
143
-
144
-
145
-
146
-
147
-
148
-
149
-
150
-
151
-
152
-
153
-
154
-
155
-
156
-
157
-
158
-
159
-
160
-
161
-
162
-
163
-
164
 |
 |

26
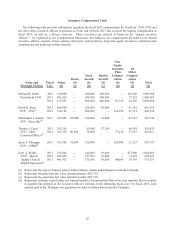
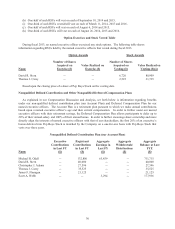
Summary Compensation Table
The following table provides information regarding the fiscal 2013 compensation for Pep Boys’ CEO, CFO and
the three other executive officers in position as of the end of fiscal 2013 that received the highest compensation in
fiscal 2013, as well as, a former executive. These executives are referred to herein as the “named executive
officers.” As explained in our Compensation Discussion and Analysis, the compensation provided to our named
executive officers consists of base salaries, short-term cash incentives, long-term equity incentives, retirement plan
contributions and heath and welfare benefits.
Name and
Principal Position
Fiscal
Year
Salary
($)
Bonus
($)
(a)
Stock
Awards
($)
(b)
Option
Awards
($)
(c)
Non-
Equity
Incentive
Plan
Compen-
sation
($)
(d)
All
Other
Compen-
sation
($)
(e)
Total
($)
Michael R. Odell 2013 830,000 -- 600,000 400,000 -- 150,508 1,980,508
President & CEO 2012 823,462 -- 600,000 400,000 -- 17,225 1,840,687
2011 817,693 -- 660,000 440,000 90,119 42,196 2,050,008
David R. Stern 2013 400,000 -- 120,000 80,000 -- 41,301 641,301
EVP – CFO(f) 2012 146,154 -- 200,000 -- 118,350 23,714 488,218
Christopher J. Adams 2013 302,885 150,000 154,000 56,000 -- 47,853 710,738
SVP – Store Ops(g)
Thomas J. Carey 2013 355,250 -- 85,800 57,200 -- 60,583 558,833
SVP – Chief
Customer Officer(h)
2012 161,538 80,000 70,000 -- 77,238 33,635 422,411
James F. Flanagan 2013 162,500 35,000 130,000 -- 105,000 21,227 453,727
SVP – CHRO(i)
Scott A. Webb 2013 332,845 -- 140,400 93,600 -- 477,960 1,044,805
EVP – Merch, 2012 455,439 -- 137,700 91,800 -- 14,182 699,221
Supply Chain &
Digital Operations(j)
2011 441,923 -- 135,000 90,000 48,689 19,745 735,357
(a) Represents the sign on bonuses paid to induce Messrs. Adams and Flanagan to join the Company.
(b) Represents the grant date fair value calculated under ASC 718.
(c) Represents the grant date fair value calculated under ASC 718.
(d) Represents amounts earned under our Annual Incentive Compensation Plan in the year reported, that were paid,
or payable but deferred at the executive officer’s election, in the following fiscal year. For fiscal 2013, such
amount paid to Mr. Flanagan was guaranteed in order to induce him to join the Company.