Pep Boys 2013 Annual Report Download - page 109
Download and view the complete annual report
Please find page 109 of the 2013 Pep Boys annual report below. You can navigate through the pages in the report by either clicking on the pages listed below, or by using the keyword search tool below to find specific information within the annual report.-
 1
1 -
2
-
3
-
4
-
5
-
6
-
7
-
8
-
9
-
10
-
11
-
12
-
13
-
14
-
15
-
16
-
17
-
18
-
19
-
20
-
21
-
22
-
23
-
24
-
25
-
26
-
27
-
28
-
29
-
30
-
31
-
32
-
33
-
34
-
35
-
36
-
37
-
38
-
39
-
40
-
41
-
42
-
43
-
44
-
45
-
46
-
47
-
48
-
49
-
50
-
51
-
52
-
53
-
54
-
55
-
56
-
57
-
58
-
59
-
60
-
61
-
62
-
63
-
64
-
65
-
66
-
67
-
68
-
69
-
70
-
71
-
72
-
73
-
74
-
75
-
76
-
77
-
78
-
79
-
80
-
81
-
82
-
83
-
84
-
85
-
86
-
87
-
88
-
89
-
90
-
91
-
92
-
93
-
94
-
95
-
96
-
97
-
98
-
 99
99 -
 100
100 -
 101
101 -
 102
102 -
 103
103 -
 104
104 -
 105
105 -
 106
106 -
 107
107 -
 108
108 -
 109
109 -
 110
110 -
 111
111 -
 112
112 -
 113
113 -
 114
114 -
 115
115 -
 116
116 -
 117
117 -
 118
118 -
 119
119 -
120
-
121
-
122
-
123
-
124
-
125
-
126
-
127
-
128
-
129
-
130
-
131
-
132
-
133
-
134
-
135
-
136
-
137
-
138
-
139
-
140
-
141
-
142
-
143
-
144
-
145
-
146
-
147
-
148
-
149
-
150
-
151
-
152
-
153
-
154
-
155
-
156
-
157
-
158
-
159
-
160
-
161
-
162
-
163
-
164
 |
 |

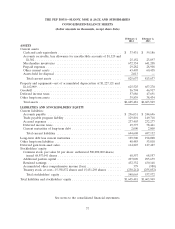
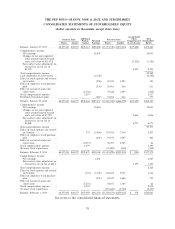
THE PEP BOYS—MANNY, MOE & JACK AND SUBSIDIARIES
CONSOLIDATED BALANCE SHEETS
(dollar amounts in thousands, except share data)
February 1, February 2,
2014 2013
ASSETS
Current assets:
Cash and cash equivalents .................................... $ 33,431 $ 59,186
Accounts receivable, less allowance for uncollectible accounts of $1,320 and
$1,302 ................................................. 25,152 23,897
Merchandise inventories ..................................... 672,354 641,208
Prepaid expenses ........................................... 29,282 28,908
Other current assets ........................................ 63,405 60,438
Assets held for disposal ...................................... 2,013 —
Total current assets ....................................... 825,637 813,637
Property and equipment—net of accumulated depreciation of $1,227,121 and
$1,162,909 ................................................ 625,525 657,270
Goodwill .................................................. 56,794 46,917
Deferred income taxes ........................................ 57,686 47,691
Other long-term assets ........................................ 39,839 38,434
Total assets ............................................... $1,605,481 $1,603,949
LIABILITIES AND STOCKHOLDERS’ EQUITY
Current liabilities:
Accounts payable .......................................... $ 256,031 $ 244,696
Trade payable program liability ................................ 129,801 149,718
Accrued expenses .......................................... 237,403 232,277
Deferred income taxes ....................................... 69,373 58,441
Current maturities of long-term debt ............................ 2,000 2,000
Total current liabilities ..................................... 694,608 687,132
Long-term debt less current maturities ............................. 199,500 198,000
Other long-term liabilities ...................................... 48,485 53,818
Deferred gain from asset sales ................................... 114,823 127,427
Stockholders’ equity:
Common stock, par value $1 per share: authorized 500,000,000 shares;
issued 68,557,041 shares .................................... 68,557 68,557
Additional paid-in capital ..................................... 297,009 295,679
Retained earnings .......................................... 432,332 430,148
Accumulated other comprehensive income (loss) .................... 379 (980)
Treasury stock, at cost—15,358,872 shares and 15,431,298 shares ........ (250,212) (255,832)
Total stockholders’ equity ................................... 548,065 537,572
Total liabilities and stockholders’ equity ............................ $1,605,481 $1,603,949
See notes to the consolidated financial statements.
37