Pep Boys 2013 Annual Report Download - page 114
Download and view the complete annual report
Please find page 114 of the 2013 Pep Boys annual report below. You can navigate through the pages in the report by either clicking on the pages listed below, or by using the keyword search tool below to find specific information within the annual report.-
 1
1 -
2
-
3
-
4
-
5
-
6
-
7
-
8
-
9
-
10
-
11
-
12
-
13
-
14
-
15
-
16
-
17
-
18
-
19
-
20
-
21
-
22
-
23
-
24
-
25
-
26
-
27
-
28
-
29
-
30
-
31
-
32
-
33
-
34
-
35
-
36
-
37
-
38
-
39
-
40
-
41
-
42
-
43
-
44
-
45
-
46
-
47
-
48
-
49
-
50
-
51
-
52
-
53
-
54
-
55
-
56
-
57
-
58
-
59
-
60
-
61
-
62
-
63
-
64
-
65
-
66
-
67
-
68
-
69
-
70
-
71
-
72
-
73
-
74
-
75
-
76
-
77
-
78
-
79
-
80
-
81
-
82
-
83
-
84
-
85
-
86
-
87
-
88
-
89
-
90
-
91
-
92
-
93
-
94
-
95
-
96
-
97
-
98
-
99
-
100
-
101
-
102
-
103
-
 104
104 -
 105
105 -
 106
106 -
 107
107 -
 108
108 -
 109
109 -
 110
110 -
 111
111 -
 112
112 -
 113
113 -
 114
114 -
 115
115 -
 116
116 -
 117
117 -
 118
118 -
 119
119 -
 120
120 -
 121
121 -
 122
122 -
 123
123 -
 124
124 -
125
-
126
-
127
-
128
-
129
-
130
-
131
-
132
-
133
-
134
-
135
-
136
-
137
-
138
-
139
-
140
-
141
-
142
-
143
-
144
-
145
-
146
-
147
-
148
-
149
-
150
-
151
-
152
-
153
-
154
-
155
-
156
-
157
-
158
-
159
-
160
-
161
-
162
-
163
-
164
 |
 |

THE PEP BOYS—MANNY, MOE & JACK AND SUBSIDIARIES
NOTES TO CONSOLIDATED FINANCIAL STATEMENTS (Continued)
Years ended February 1, 2014, February 2, 2013 and January 28, 2012
NOTE 1—SUMMARY OF SIGNIFICANT ACCOUNTING POLICIES (Continued)
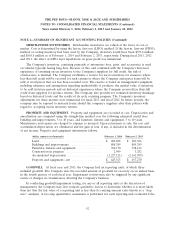
MERCHANDISE INVENTORIES Merchandise inventories are valued at the lower of cost or
market. Cost is determined by using the last-in, first-out (LIFO) method. If the first-in, first-out (FIFO)
method of costing inventory had been used by the Company, inventory would have been $579.8 million
and $565.8 million as of February 1, 2014 and February 2, 2013, respectively. During fiscal 2013, 2012
and 2011, the effect of LIFO layer liquidations on gross profit was immaterial.
The Company’s inventory, consisting primarily of automotive tires, parts, and accessories, is used
on vehicles typically having long lives. Because of this, and combined with the Company’s historical
experience of returning excess inventory to the Company’s suppliers for full credit, the risk of
obsolescence is minimal. The Company establishes a reserve for excess inventory for instances where
less than full credit will be received for such returns or where the Company anticipates items will be
sold at retail prices that are less than recorded costs. The reserve is based on management’s judgment,
including estimates and assumptions regarding marketability of products, the market value of inventory
to be sold in future periods and on historical experiences where the Company received less than full
credit from suppliers for product returns. The Company also provides for estimated inventory shrinkage
based on historical levels and the results of its cycle counting program. The Company’s inventory
adjustments for these matters were immaterial for fiscal 2013 and fiscal 2012. In future periods, the
company may be exposed to material losses should the company’s suppliers alter their policies with
regard to accepting excess inventory returns.
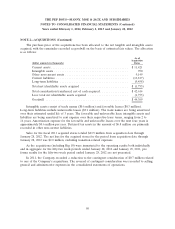
PROPERTY AND EQUIPMENT Property and equipment are recorded at cost. Depreciation and
amortization are computed using the straight-line method over the following estimated useful lives:
building and improvements, 5 to 40 years, and furniture, fixtures and equipment, 3 to 10 years.
Maintenance and repairs are charged to expense as incurred. Upon retirement or sale, the cost and
accumulated depreciation are eliminated and the gain or loss, if any, is included in the determination
of net income. Property and equipment information follows:
(dollar amounts in thousands) February 1, 2014 February 2, 2013
Land ................................... $ 202,038 $ 203,386
Buildings and improvements .................. 888,389 885,389
Furniture, fixtures and equipment .............. 760,170 728,122
Construction in progress ..................... 2,049 3,282
Accumulated depreciation .................... (1,227,121) (1,162,909)
Property and equipment—net ................. $ 625,525 $ 657,270
GOODWILL At fiscal year end 2013, the Company had six reporting units, of which three
included goodwill. The Company tests the recorded amount of goodwill for recovery on an annual basis
in the fourth quarter of each fiscal year. Impairment reviews may also be triggered by any significant
events or changes in circumstances affecting the Company’s business.
In conducting goodwill impairment testing, for any or all reporting units at the discretion of
management, the Company may first evaluate qualitative factors to determine whether it is more likely
than not that the fair value of a reporting unit is less than its carrying amount (also known as a ‘‘step
zero’’ analysis). A two-step quantitative assessment is performed for each reporting unit evaluated if the
42