Pep Boys 2013 Annual Report Download - page 21
Download and view the complete annual report
Please find page 21 of the 2013 Pep Boys annual report below. You can navigate through the pages in the report by either clicking on the pages listed below, or by using the keyword search tool below to find specific information within the annual report.-
 1
1 -
 2
2 -
 3
3 -
 4
4 -
 5
5 -
 6
6 -
 7
7 -
 8
8 -
 9
9 -
 10
10 -
 11
11 -
 12
12 -
 13
13 -
 14
14 -
 15
15 -
 16
16 -
 17
17 -
 18
18 -
 19
19 -
 20
20 -
 21
21 -
 22
22 -
 23
23 -
 24
24 -
 25
25 -
 26
26 -
 27
27 -
 28
28 -
 29
29 -
 30
30 -
 31
31 -
 32
32 -
 33
33 -
 34
34 -
 35
35 -
 36
36 -
 37
37 -
 38
38 -
 39
39 -
 40
40 -
 41
41 -
 42
42 -
 43
43 -
 44
44 -
 45
45 -
 46
46 -
 47
47 -
 48
48 -
 49
49 -
 50
50 -
 51
51 -
 52
52 -
 53
53 -
 54
54 -
 55
55 -
 56
56 -
 57
57 -
 58
58 -
 59
59 -
 60
60 -
 61
61 -
 62
62 -
 63
63 -
 64
64 -
 65
65 -
 66
66 -
 67
67 -
 68
68 -
 69
69 -
 70
70 -
 71
71 -
 72
72 -
 73
73 -
 74
74 -
 75
75 -
 76
76 -
 77
77 -
 78
78 -
 79
79 -
 80
80 -
 81
81 -
 82
82 -
 83
83 -
 84
84 -
 85
85 -
 86
86 -
 87
87 -
 88
88 -
 89
89 -
 90
90 -
 91
91 -
 92
92 -
 93
93 -
 94
94 -
 95
95 -
 96
96 -
 97
97 -
 98
98 -
 99
99 -
 100
100 -
 101
101 -
 102
102 -
 103
103 -
 104
104 -
 105
105 -
 106
106 -
 107
107 -
 108
108 -
 109
109 -
 110
110 -
 111
111 -
 112
112 -
 113
113 -
 114
114 -
 115
115 -
 116
116 -
 117
117 -
 118
118 -
 119
119 -
 120
120 -
 121
121 -
 122
122 -
 123
123 -
 124
124 -
 125
125 -
 126
126 -
 127
127 -
 128
128 -
 129
129 -
 130
130 -
 131
131 -
 132
132 -
 133
133 -
 134
134 -
 135
135 -
 136
136 -
 137
137 -
 138
138 -
 139
139 -
 140
140 -
 141
141 -
 142
142 -
 143
143 -
 144
144 -
 145
145 -
 146
146 -
 147
147 -
 148
148 -
 149
149 -
 150
150 -
 151
151 -
 152
152 -
 153
153 -
 154
154 -
 155
155 -
 156
156 -
 157
157 -
 158
158 -
 159
159 -
 160
160 -
 161
161 -
 162
162 -
 163
163 -
 164
164
 |
 |

16
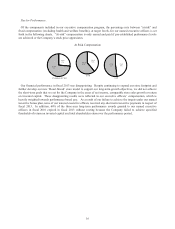
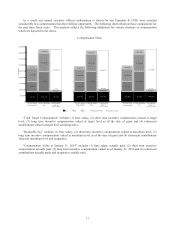
Pay for Performance.
Of the components included in our executive compensation program, the percentage mix between “at-risk” and
fixed compensation (excluding health and welfare benefits), at target levels, for our named executive officers is set
forth in the following charts. “At-risk” compensation is only earned and paid if pre-established performance levels
are achieved or the Company’s stock price appreciates.
At Risk Compensation
President & CEO
Fixed
27%
At Risk
73%
SVP
At Risk
52%
Fixed
48%
Our financial performance in fiscal 2013 was disappointing. Despite continuing to expand our store footprint and
further develop our new ‘Road Ahead’ store model to support our long-term growth objectives, we did not achieve
the short-term goals that we set for the Company in the areas of net income, comparable store sales growth or return
on invested capital. These disappointing results were reflected in our executive officers’ compensation, which is
heavily weighted towards performance-based pay. As a result of our failure to achieve the targets under our annual
incentive bonus plan, none of our tenured executive officers received any short-term incentive payments in respect of
fiscal 2013. In addition, 60% of the three-year long-term performance awards granted to our named executive
officers in fiscal 2010 expired in fiscal 2013 without vesting because the Company failed to achieve specified
thresholds of return on invested capital and total shareholder return over the performance period.
EVP
Fixed
39%
At Risk
61%
