Pep Boys 2013 Annual Report Download - page 131
Download and view the complete annual report
Please find page 131 of the 2013 Pep Boys annual report below. You can navigate through the pages in the report by either clicking on the pages listed below, or by using the keyword search tool below to find specific information within the annual report.-
 1
1 -
2
-
3
-
4
-
5
-
6
-
7
-
8
-
9
-
10
-
11
-
12
-
13
-
14
-
15
-
16
-
17
-
18
-
19
-
20
-
21
-
22
-
23
-
24
-
25
-
26
-
27
-
28
-
29
-
30
-
31
-
32
-
33
-
34
-
35
-
36
-
37
-
38
-
39
-
40
-
41
-
42
-
43
-
44
-
45
-
46
-
47
-
48
-
49
-
50
-
51
-
52
-
53
-
54
-
55
-
56
-
57
-
58
-
59
-
60
-
61
-
62
-
63
-
64
-
65
-
66
-
67
-
68
-
69
-
70
-
71
-
72
-
73
-
74
-
75
-
76
-
77
-
78
-
79
-
80
-
81
-
82
-
83
-
84
-
85
-
86
-
87
-
88
-
89
-
90
-
91
-
92
-
93
-
94
-
95
-
96
-
97
-
98
-
99
-
100
-
101
-
102
-
103
-
104
-
105
-
106
-
107
-
108
-
109
-
110
-
111
-
112
-
113
-
114
-
115
-
116
-
117
-
118
-
119
-
120
-
 121
121 -
 122
122 -
 123
123 -
 124
124 -
 125
125 -
 126
126 -
 127
127 -
 128
128 -
 129
129 -
 130
130 -
 131
131 -
 132
132 -
 133
133 -
 134
134 -
 135
135 -
 136
136 -
 137
137 -
 138
138 -
 139
139 -
 140
140 -
 141
141 -
142
-
143
-
144
-
145
-
146
-
147
-
148
-
149
-
150
-
151
-
152
-
153
-
154
-
155
-
156
-
157
-
158
-
159
-
160
-
161
-
162
-
163
-
164
 |
 |

THE PEP BOYS—MANNY, MOE & JACK AND SUBSIDIARIES
NOTES TO CONSOLIDATED FINANCIAL STATEMENTS (Continued)
Years ended February 1, 2014, February 2, 2013 and January 28, 2012
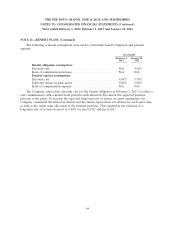
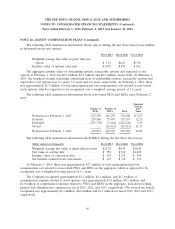
NOTE 8—INCOME TAXES (Continued)
Unrecognized tax benefits include $0.7 million, $0.9 million, and $1.3 million, as of February 1,
2014, February 2, 2013 and January 28, 2012, respectively, that if recognized would affect the
Company’s annual effective tax rate. The Company does not anticipate material changes to its
unrecognized tax benefits within the next twelve months.
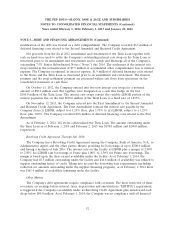
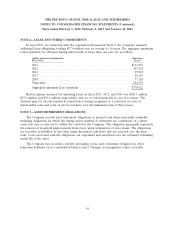
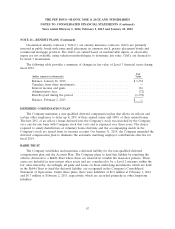
NOTE 9—STOCKHOLDERS’ EQUITY
On December 12, 2012, the Company’s Board of Directors authorized a program to repurchase up
to $50.0 million of the Company’s common stock to be made from time to time in the open market or
in privately negotiated transactions, with no expiration date. The Company repurchased 237,624 shares
of Common Stock for $2.8 million in fiscal 2013 and 35,000 shares of Common Stock for $0.3 million
in fiscal 2012. All of these repurchased shares were placed into the Company’s treasury.
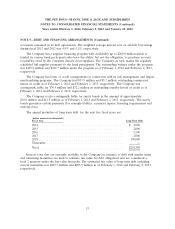
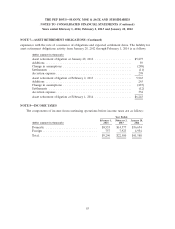
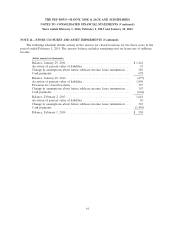
NOTE 10—ACCUMULATED OTHER COMPREHENSIVE INCOME (LOSS)
The following table presents changes in accumulated other comprehensive income (loss) for the
year ended February 1, 2014:
Gains on Cash
Flow Hedges
February 1,
(dollar amounts in thousands) 2014
Beginning balance ...................................... $(980)
Other comprehensive income before reclassifications, net of $584 tax . 975
Amounts reclassified from accumulated other comprehensive income
(loss), net of $230 tax(a) ................................. 384
Net current-period other comprehensive income ................. 1,359
Ending balance ......................................... $ 379
(a) Reclassified amount increased interest expense.
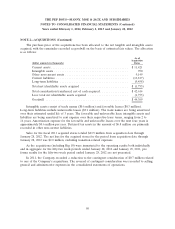
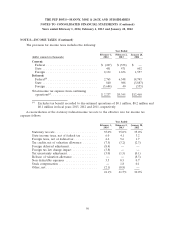
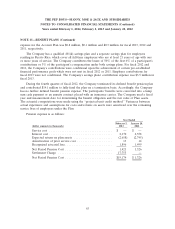
NOTE 11—STORE CLOSURES AND ASSET IMPAIRMENTS
During fiscal 2013, the Company recorded a $7.7 million impairment charge related to 47 stores,
four of which were classified as held for disposal and 43 of which were classified as held and used as of
February 1, 2014. Of the $7.7 million impairment charge, $2.4 million was charged to merchandise cost
of sales, and $5.3 million was charged to service cost of sales. In fiscal 2012, the Company recorded a
$10.6 million impairment charge related to 49 stores classified as held and used. Of the $10.6 million
impairment charge, $5.1 million was charged to merchandise cost of sales, and $5.5 million was charged
to service cost of sales. In both years the Company used a probability-weighted approach and estimates
of expected future cash flows to determine the fair value of these stores. Discount and growth rate
assumptions were derived from current economic conditions, management’s expectations and projected
trends of current operating results. The fair market value estimates are classified as a Level 2 or
Level 3 measure within the fair value hierarchy. The remaining fair value of the impaired assets was
$4.2 million and $2.3 million at February 1, 2014 and February 2, 2013, respectively.
59