Pep Boys 2013 Annual Report Download - page 110
Download and view the complete annual report
Please find page 110 of the 2013 Pep Boys annual report below. You can navigate through the pages in the report by either clicking on the pages listed below, or by using the keyword search tool below to find specific information within the annual report.-
 1
1 -
2
-
3
-
4
-
5
-
6
-
7
-
8
-
9
-
10
-
11
-
12
-
13
-
14
-
15
-
16
-
17
-
18
-
19
-
20
-
21
-
22
-
23
-
24
-
25
-
26
-
27
-
28
-
29
-
30
-
31
-
32
-
33
-
34
-
35
-
36
-
37
-
38
-
39
-
40
-
41
-
42
-
43
-
44
-
45
-
46
-
47
-
48
-
49
-
50
-
51
-
52
-
53
-
54
-
55
-
56
-
57
-
58
-
59
-
60
-
61
-
62
-
63
-
64
-
65
-
66
-
67
-
68
-
69
-
70
-
71
-
72
-
73
-
74
-
75
-
76
-
77
-
78
-
79
-
80
-
81
-
82
-
83
-
84
-
85
-
86
-
87
-
88
-
89
-
90
-
91
-
92
-
93
-
94
-
95
-
96
-
97
-
98
-
99
-
 100
100 -
 101
101 -
 102
102 -
 103
103 -
 104
104 -
 105
105 -
 106
106 -
 107
107 -
 108
108 -
 109
109 -
 110
110 -
 111
111 -
 112
112 -
 113
113 -
 114
114 -
 115
115 -
 116
116 -
 117
117 -
 118
118 -
 119
119 -
 120
120 -
121
-
122
-
123
-
124
-
125
-
126
-
127
-
128
-
129
-
130
-
131
-
132
-
133
-
134
-
135
-
136
-
137
-
138
-
139
-
140
-
141
-
142
-
143
-
144
-
145
-
146
-
147
-
148
-
149
-
150
-
151
-
152
-
153
-
154
-
155
-
156
-
157
-
158
-
159
-
160
-
161
-
162
-
163
-
164
 |
 |

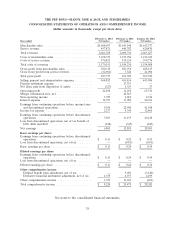
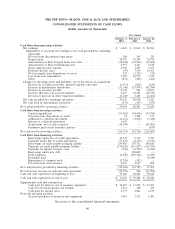
THE PEP BOYS—MANNY, MOE & JACK AND SUBSIDIARIES
CONSOLIDATED STATEMENTS OF OPERATIONS AND COMPREHENSIVE INCOME
(dollar amounts in thousands, except per share data)
February 1, 2014 February 2, 2013 January 28, 2012
Year ended (52 weeks) (53 weeks) (52 weeks)
Merchandise sales ............................ $1,608,697 $1,643,948 $1,642,757
Service revenue .............................. 457,871 446,782 420,870
Total revenues ............................... 2,066,568 2,090,730 2,063,627
Costs of merchandise sales ...................... 1,108,359 1,159,994 1,154,322
Costs of service revenue ........................ 470,832 439,236 399,776
Total costs of revenues ......................... 1,579,191 1,599,230 1,554,098
Gross profit from merchandise sales ............... 500,338 483,954 488,435
Gross (loss) profit from service revenue ............. (12,961) 7,546 21,094
Total gross profit ............................. 487,377 491,500 509,529
Selling, general and administrative expenses .......... 464,852 463,416 443,986
Pension settlement expense ...................... — 17,753 —
Net (loss) gain from disposition of assets ............ (227) 1,323 27
Operating profit .............................. 22,298 11,654 65,570
Merger termination fees, net ..................... — 42,816 —
Non-operating income ......................... 1,789 2,012 2,324
Interest expense .............................. 14,797 33,982 26,306
Earnings from continuing operations before income taxes
and discontinued operations .................... 9,290 22,500 41,588
Income tax expense ........................... 2,237 9,345 12,460
Earnings from continuing operations before discontinued
operations ................................ 7,053 13,155 29,128
Loss from discontinued operations, net of tax benefit of
$102, $186 and $121 ......................... (188) (345) (225)
Net earnings ................................ 6,865 12,810 28,903
Basic earnings per share:
Earnings from continuing operations before discontinued
operations ................................ $ 0.13 $ 0.25 $ 0.55
Loss from discontinued operations, net of tax ......... — (0.01) (0.01)
Basic earnings per share ........................ $ 0.13 $ 0.24 $ 0.54
Diluted earnings per share:
Earnings from continuing operations before discontinued
operations ................................ $ 0.13 $ 0.24 $ 0.54
Loss from discontinued operations, net of tax ......... — — —
Diluted earnings per share ...................... $ 0.13 $ 0.24 $ 0.54
Other comprehensive income:
Defined benefit plan adjustment, net of tax ......... — 9,696 (3,120)
Derivative financial instrument adjustment, net of tax . . 1,359 6,973 2,499
Other comprehensive income .................... 1,359 16,669 (621)
Total comprehensive income ..................... $ 8,224 $ 29,479 $ 28,282
See notes to the consolidated financial statements.
38