Pep Boys 2013 Annual Report Download - page 141
Download and view the complete annual report
Please find page 141 of the 2013 Pep Boys annual report below. You can navigate through the pages in the report by either clicking on the pages listed below, or by using the keyword search tool below to find specific information within the annual report.-
 1
1 -
2
-
3
-
4
-
5
-
6
-
7
-
8
-
9
-
10
-
11
-
12
-
13
-
14
-
15
-
16
-
17
-
18
-
19
-
20
-
21
-
22
-
23
-
24
-
25
-
26
-
27
-
28
-
29
-
30
-
31
-
32
-
33
-
34
-
35
-
36
-
37
-
38
-
39
-
40
-
41
-
42
-
43
-
44
-
45
-
46
-
47
-
48
-
49
-
50
-
51
-
52
-
53
-
54
-
55
-
56
-
57
-
58
-
59
-
60
-
61
-
62
-
63
-
64
-
65
-
66
-
67
-
68
-
69
-
70
-
71
-
72
-
73
-
74
-
75
-
76
-
77
-
78
-
79
-
80
-
81
-
82
-
83
-
84
-
85
-
86
-
87
-
88
-
89
-
90
-
91
-
92
-
93
-
94
-
95
-
96
-
97
-
98
-
99
-
100
-
101
-
102
-
103
-
104
-
105
-
106
-
107
-
108
-
109
-
110
-
111
-
112
-
113
-
114
-
115
-
116
-
117
-
118
-
119
-
120
-
121
-
122
-
123
-
124
-
125
-
126
-
127
-
128
-
129
-
130
-
 131
131 -
 132
132 -
 133
133 -
 134
134 -
 135
135 -
 136
136 -
 137
137 -
 138
138 -
 139
139 -
 140
140 -
 141
141 -
 142
142 -
 143
143 -
 144
144 -
 145
145 -
 146
146 -
 147
147 -
 148
148 -
 149
149 -
 150
150 -
 151
151 -
152
-
153
-
154
-
155
-
156
-
157
-
158
-
159
-
160
-
161
-
162
-
163
-
164
 |
 |

THE PEP BOYS—MANNY, MOE & JACK AND SUBSIDIARIES
NOTES TO CONSOLIDATED FINANCIAL STATEMENTS (Continued)
Years ended February 1, 2014, February 2, 2013 and January 28, 2012
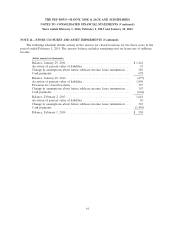
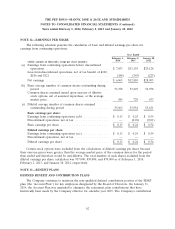
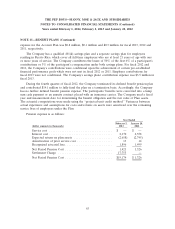
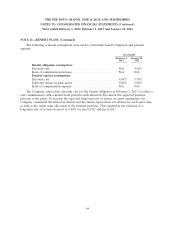
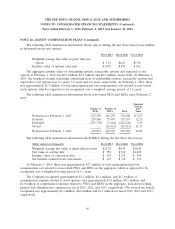
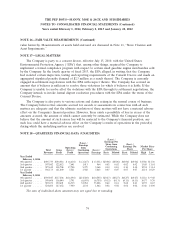
NOTE 14—EQUITY COMPENSATION PLANS (Continued)
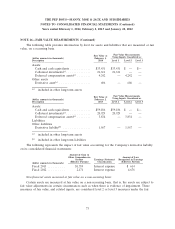
The following table summarizes information about options during the last three fiscal years (dollars
in thousands except per option):
Fiscal 2013 Fiscal 2012 Fiscal 2011
Weighted average fair value at grant date per
option .............................. $ 5.11 $4.65 $5.38
Intrinsic value of options exercised ........... $1,059 $ 874 $ 202
The aggregate intrinsic value of outstanding options, exercisable options and expected to vest
options at February 1, 2014 was $5.8 million, $5.5 million and $0.3 million, respectively. At February 1,
2014, the weighted average remaining contractual term of outstanding options, exercisable options and
expected to vest options was 4.1 years, 3.0 years and 6.6 years, respectively. At February 1, 2014, there
was approximately $1.7 million of total unrecognized pre-tax compensation cost related to non-vested
stock options, which is expected to be recognized over a weighted average period of 1.3 years.
The following table summarizes information about non-vested PSUs and RSUs since February 2,
2013:
Weighted
Average
Number of Number of Fair
PSUs RSUs Total Value
Nonvested at February 2, 2013 ........ 651,305 145,295 796,600 $ 9.67
Granted ......................... 259,986 77,607 337,593 12.23
Forfeited ........................ (235,778) (7,442) (243,220) 9.30
Vested .......................... — (65,515) (65,515) 11.57
Nonvested at February 1, 2014 ........ 675,513 149,945 825,458 10.68
The following table summarizes information about RSUs during the last three fiscal years:
(dollar amounts in thousands) Fiscal 2013 Fiscal 2012 Fiscal 2011
Weighted average fair value at grant date per unit $12.23 $9.48 $10.45
Fair value at vesting date .................. $ 758 $768 $1,498
Intrinsic value at conversion date ............. $ 525 $218 $ 896
Tax benefits realized from conversions ......... $ 197 $ 82 $ 336
At February 1, 2014, there was approximately $2.7 million of total unrecognized pre-tax
compensation cost related to non-vested PSUs and RSUs in the aggregate, which is expected to be
recognized over a weighted-average period of 1.1 years.
The Company recognized approximately $1.2 million, $1.1 million, and $1.3 million of
compensation expense related to stock options, and approximately $1.8 million, $0.2 million, and
$1.9 million of compensation expense related to PSUs and RSUs in the aggregate, included in selling,
general and administrative expenses for fiscal 2013, 2012, and 2011, respectively. The related tax benefit
recognized was approximately $1.1 million, $0.4 million and $1.2 million for fiscal 2013, 2012 and 2011,
respectively.
69