Pep Boys 2013 Annual Report Download - page 95
Download and view the complete annual report
Please find page 95 of the 2013 Pep Boys annual report below. You can navigate through the pages in the report by either clicking on the pages listed below, or by using the keyword search tool below to find specific information within the annual report.-
 1
1 -
2
-
3
-
4
-
5
-
6
-
7
-
8
-
9
-
10
-
11
-
12
-
13
-
14
-
15
-
16
-
17
-
18
-
19
-
20
-
21
-
22
-
23
-
24
-
25
-
26
-
27
-
28
-
29
-
30
-
31
-
32
-
33
-
34
-
35
-
36
-
37
-
38
-
39
-
40
-
41
-
42
-
43
-
44
-
45
-
46
-
47
-
48
-
49
-
50
-
51
-
52
-
53
-
54
-
55
-
56
-
57
-
58
-
59
-
60
-
61
-
62
-
63
-
64
-
65
-
66
-
67
-
68
-
69
-
70
-
71
-
72
-
73
-
74
-
75
-
76
-
77
-
78
-
79
-
80
-
81
-
82
-
83
-
84
-
 85
85 -
 86
86 -
 87
87 -
 88
88 -
 89
89 -
 90
90 -
 91
91 -
 92
92 -
 93
93 -
 94
94 -
 95
95 -
 96
96 -
 97
97 -
 98
98 -
 99
99 -
 100
100 -
 101
101 -
 102
102 -
 103
103 -
 104
104 -
 105
105 -
106
-
107
-
108
-
109
-
110
-
111
-
112
-
113
-
114
-
115
-
116
-
117
-
118
-
119
-
120
-
121
-
122
-
123
-
124
-
125
-
126
-
127
-
128
-
129
-
130
-
131
-
132
-
133
-
134
-
135
-
136
-
137
-
138
-
139
-
140
-
141
-
142
-
143
-
144
-
145
-
146
-
147
-
148
-
149
-
150
-
151
-
152
-
153
-
154
-
155
-
156
-
157
-
158
-
159
-
160
-
161
-
162
-
163
-
164
 |
 |
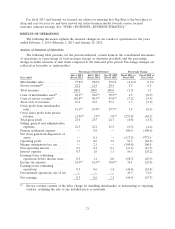
31.1% for fiscal 2013 from 29.4% in fiscal 2012. Gross profit from merchandise sales in fiscal 2013 and
2012 included an asset impairment charge of $2.3 million and $5.1 million, respectively. Excluding this
item from both years, gross profit margin from merchandise sales improved to 31.3% in fiscal 2013
from 29.8% in the prior year. The improvement over the prior year was primarily due to improved
product margins in tires, brakes, batteries and oil.
Gross margin loss from service revenue for fiscal 2013 widened by $20.5 million to a loss of
$13.0 million from profit of $7.5 million for fiscal 2012. In accordance with GAAP, service revenue is
limited to labor sales (excludes any revenue from installed parts and materials) and costs of service
revenues includes the fully loaded service center payroll and related employee benefits and service
center occupancy costs (rents, utilities and building maintenance). Excluding impairment charges of
$5.3 million and $5.4 million in fiscal 2013 and 2012, respectively, gross margin from service revenue
decreased by 460 basis points to a 1.7% loss in fiscal 2013 from 2.9% profit in fiscal 2012. The decrease
in service revenue gross profit margin was primarily due to higher payroll and related expense of
320 basis points and higher occupancy costs of 154 basis points (depreciation and rent).
Selling, general and administrative expenses as a percentage of total revenues increased to 22.5%
for fiscal year 2013 from 22.2% for fiscal 2012. Selling, general and administrative expenses for fiscal
2013 increased $1.4 million, or 0.3%, to $464.9 million from $463.4 million for fiscal 2012. The increase
as a percentage of sales reflects de-leveraging of selling, general and administrative expenses through
reduced sales in fiscal 2013(fiscal 2012 included 53 weeks).
In the fourth quarter of fiscal 2012, in accordance with Internal Revenue Service and Pension
Benefit Guaranty Corporation requirements, we contributed $14.1 million to fully fund our Defined
Benefit Pension Plan on a termination basis and incurred a settlement charge of $17.8 million (see
Note 13 to the Consolidated Financial Statements).
In the fourth quarter of fiscal 2012, we sold our regional administration building in Los Angeles,
CA, which resulted in a gain from disposition of assets, net of expenses, of $1.3 million.
In the second quarter of fiscal 2012, we terminated our proposed ‘‘go private’’ transaction and
recorded the settlement proceeds, net of merger related costs, of $42.8 million in the consolidated
statement of operations and comprehensive income.
Interest expense for fiscal 2013 was $14.8 million, a decrease of $19.2 million, from $34.0 million
reported for fiscal 2012. Excluding refinancing costs of $0.4 million and $11.2 million in fiscal 2013 and
2012, respectively, interest declined by $8.4 million and reflects a lower interest rate on reduced total
debt outstanding. In the third quarter of fiscal 2012, we refinanced our long term debt to reduce the
amount outstanding by $95.1 million and in the fourth quarter of fiscal 2013, we further reduced the
interest rate on our Senior Secured Term Loan by 75 basis points (See Note 5 to the Consolidated
Financial Statements).
Our income tax expense for fiscal 2013 was $2.2 million, or an effective rate of 24.1%, as
compared to an expense of $9.3 million, or an effective rate of 41.5%, for fiscal 2012. The decrease in
rate from period to period was primarily driven by a reduction in pre-tax income in relation to certain
permanent tax items and tax credits. In addition, the rate was impacted by a change in foreign tax law
enacted during fiscal 2013 and a favorable adjustment to deferred tax assets in our foreign operations.
As a result of the foregoing, we had net earnings of $6.9 million for fiscal 2013 as compared to net
earnings of $12.8 million for fiscal 2012. Our diluted earnings per share were $0.13 as compared to
$0.24 in the prior year period.
23