Pep Boys 2013 Annual Report Download - page 142
Download and view the complete annual report
Please find page 142 of the 2013 Pep Boys annual report below. You can navigate through the pages in the report by either clicking on the pages listed below, or by using the keyword search tool below to find specific information within the annual report.-
 1
1 -
2
-
3
-
4
-
5
-
6
-
7
-
8
-
9
-
10
-
11
-
12
-
13
-
14
-
15
-
16
-
17
-
18
-
19
-
20
-
21
-
22
-
23
-
24
-
25
-
26
-
27
-
28
-
29
-
30
-
31
-
32
-
33
-
34
-
35
-
36
-
37
-
38
-
39
-
40
-
41
-
42
-
43
-
44
-
45
-
46
-
47
-
48
-
49
-
50
-
51
-
52
-
53
-
54
-
55
-
56
-
57
-
58
-
59
-
60
-
61
-
62
-
63
-
64
-
65
-
66
-
67
-
68
-
69
-
70
-
71
-
72
-
73
-
74
-
75
-
76
-
77
-
78
-
79
-
80
-
81
-
82
-
83
-
84
-
85
-
86
-
87
-
88
-
89
-
90
-
91
-
92
-
93
-
94
-
95
-
96
-
97
-
98
-
99
-
100
-
101
-
102
-
103
-
104
-
105
-
106
-
107
-
108
-
109
-
110
-
111
-
112
-
113
-
114
-
115
-
116
-
117
-
118
-
119
-
120
-
121
-
122
-
123
-
124
-
125
-
126
-
127
-
128
-
129
-
130
-
131
-
 132
132 -
 133
133 -
 134
134 -
 135
135 -
 136
136 -
 137
137 -
 138
138 -
 139
139 -
 140
140 -
 141
141 -
 142
142 -
 143
143 -
 144
144 -
 145
145 -
 146
146 -
 147
147 -
 148
148 -
 149
149 -
 150
150 -
 151
151 -
 152
152 -
153
-
154
-
155
-
156
-
157
-
158
-
159
-
160
-
161
-
162
-
163
-
164
 |
 |

THE PEP BOYS—MANNY, MOE & JACK AND SUBSIDIARIES
NOTES TO CONSOLIDATED FINANCIAL STATEMENTS (Continued)
Years ended February 1, 2014, February 2, 2013 and January 28, 2012
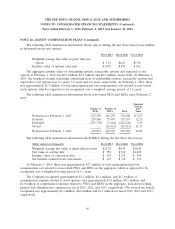
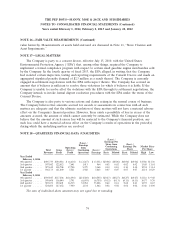
NOTE 14—EQUITY COMPENSATION PLANS (Continued)
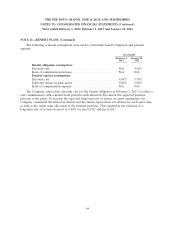
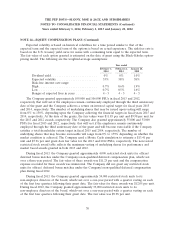
Expected volatility is based on historical volatilities for a time period similar to that of the
expected term and the expected term of the options is based on actual experience. The risk-free rate is
based on the U.S. treasury yield curve for issues with a remaining term equal to the expected term.
The fair value of each option granted is estimated on the date of grant using the Black-Scholes option-
pricing model. The following are the weighted-average assumptions:
Year ended
February 1, February 2, January 28,
2014 2013 2012
Dividend yield .......................... 0% 0% 1.0%
Expected volatility ....................... 53% 58% 58%
Risk-free interest rate range:
High ................................. 0.7% 0.6% 1.9%
Low ................................. 0.7% 0.5% 1.6%
Ranges of expected lives in years ............ 4 - 5 4 - 5 4 - 5
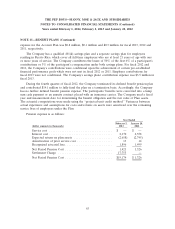
The Company granted approximately 109,000 and 106,000 PSUs in fiscal 2013 and 2012,
respectively that will vest if the employees remain continuously employed through the third anniversary
date of the grant and the Company achieves a return on invested capital target for fiscal years 2015
and 2014, respectively. The number of underlying shares that may be issued upon vesting will range
from 0% to 150%, depending upon the Company achieving the financial targets in fiscal years 2015 and
2014, respectively. At the date of the grants, the fair values were $11.85 per unit and $9.98 per unit for
the 2013 and 2012 awards, respectively. The Company also granted approximately 55,000 and 53,000
PSUs for fiscal 2013 and 2012, respectively, that will vest if the employees remain continuously
employed through the third anniversary date of the grant and will become exercisable if the Company
satisfies a total shareholder return target in fiscal 2015 and 2014, respectively. The number of
underlying shares that may become exercisable will range from 0% to 175% depending on whether the
market condition is achieved. The Company used a Monte Carlo simulation to estimate a $13.41 per
unit and $7.96 per unit grant date fair value for the 2013 and 2012 PSUs, respectively. The non-vested
restricted stock award table reflects the maximum vesting of underlying shares for performance and
market based awards granted in both 2013 and 2012.
During fiscal 2013, the Company granted approximately 4,000 restricted stock units for officers’
deferred bonus matches under the Company’s non-qualified deferred compensation plan, which vest
over a three-year period. The fair value of these awards was $11.25 per unit and the compensation
expense recorded for these awards was immaterial. The Company did not grant any restricted stock
units for officers’ deferred bonus matches under the Company’s non-qualified deferred compensation
plan during fiscal 2012.
During fiscal 2013, the Company granted approximately 54,000 restricted stock units to its
non-employee directors of the board, which vest over a one-year period with a quarter vesting on each
of the first four quarters following their grant date. The fair value for these awards was $12.05 per unit.
During fiscal 2012, the Company granted approximately 33,000 restricted stock units to its
non-employee directors of the board, which vest over a one-year period with a quarter vesting on each
of the first four quarters following their grant date. The fair value was $9.98 per unit.
70