Pep Boys 2013 Annual Report Download - page 33
Download and view the complete annual report
Please find page 33 of the 2013 Pep Boys annual report below. You can navigate through the pages in the report by either clicking on the pages listed below, or by using the keyword search tool below to find specific information within the annual report.-
 1
1 -
2
-
3
-
4
-
5
-
6
-
7
-
8
-
9
-
10
-
11
-
12
-
13
-
14
-
15
-
16
-
17
-
18
-
19
-
20
-
21
-
22
-
 23
23 -
 24
24 -
 25
25 -
 26
26 -
 27
27 -
 28
28 -
 29
29 -
 30
30 -
 31
31 -
 32
32 -
 33
33 -
 34
34 -
 35
35 -
 36
36 -
 37
37 -
 38
38 -
 39
39 -
 40
40 -
 41
41 -
 42
42 -
 43
43 -
44
-
45
-
46
-
47
-
48
-
49
-
50
-
51
-
52
-
53
-
54
-
55
-
56
-
57
-
58
-
59
-
60
-
61
-
62
-
63
-
64
-
65
-
66
-
67
-
68
-
69
-
70
-
71
-
72
-
73
-
74
-
75
-
76
-
77
-
78
-
79
-
80
-
81
-
82
-
83
-
84
-
85
-
86
-
87
-
88
-
89
-
90
-
91
-
92
-
93
-
94
-
95
-
96
-
97
-
98
-
99
-
100
-
101
-
102
-
103
-
104
-
105
-
106
-
107
-
108
-
109
-
110
-
111
-
112
-
113
-
114
-
115
-
116
-
117
-
118
-
119
-
120
-
121
-
122
-
123
-
124
-
125
-
126
-
127
-
128
-
129
-
130
-
131
-
132
-
133
-
134
-
135
-
136
-
137
-
138
-
139
-
140
-
141
-
142
-
143
-
144
-
145
-
146
-
147
-
148
-
149
-
150
-
151
-
152
-
153
-
154
-
155
-
156
-
157
-
158
-
159
-
160
-
161
-
162
-
163
-
164
 |
 |

28
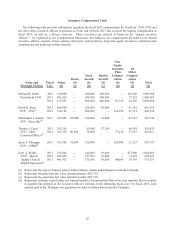
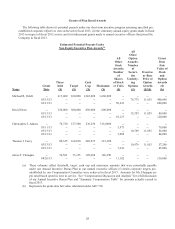
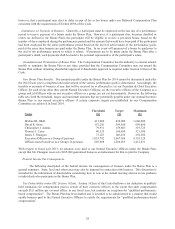
Grants of Plan Based Awards
The following table shows (i) potential payouts under our short-term incentive program assuming specified pre-
established corporate objectives were achieved in fiscal 2013, (ii) the customary annual equity grants made in fiscal
2013 in respect of fiscal 2012 service and (iii) inducement grants made to named executive officers that joined the
Company in fiscal 2013.
Estimated Potential Payouts Under
Non-Equity Incentive Plan Awards(a)
Name
Grant
Date
Thres-
hold
($)
Target
($)
Cash
Cap
($)
Maximum
($)
All
Other
Stock
Awards:
Number
of
Shares
of Stock
or Units
(#)
All
Other
Option
Awards:
Number
of
Securi-
ties
Underly-
ing
Options
(#)
Exercise
or Base
Price of
Option
Awards
($/Sh)
Grant
Date
Fair
Value of
Stock
and
Option
Awards
($)
(b)
Michael R. Odell -- 415,000 830,000 1,245,000 1,660,000 -- -- -- --
03/13/13 -- -- -- -- -- 76,775 11.855 400,000
03/13/13 -- -- -- -- 50,633 -- -- 600,000
David Stern -- 150,000 300,000 450,000 600,000 -- -- -- --
03/13/13 -- -- -- -- -- 15,355 11.855 80,000
03/13/13 -- -- -- -- 10,127 -- -- 120,000
Christopher J. Adams -- 78,750 157,500 236,250 315,0000 -- -- -- --
03/11/13 -- -- -- -- 5,973 -- -- 70,000
03/13/13 -- -- -- -- -- 10,749 11.855 56,000
03/13/13 -- -- -- -- 7,089 -- -- 84,000
Thomas J. Carey -- 80,325 160,650 240,975 321,300 -- -- -- --
03/13/13 -- -- -- -- -- 10,979 11.855 57,200
03/13/13 -- -- -- -- 7,241 -- -- 85,800
James F. Flanagan -- 36,562 73,125 109,688 146,250 -- -- -- --
08/26/13 -- -- -- -- 11,102 -- -- 130,000
(a) These columns reflect threshold, target, cash cap and maximum amounts that were potentially payable
under our Annual Incentive Bonus Plan to our named executive officers if certain corporate targets pre-
established by our Compensation Committee were achieved in fiscal 2013. Amounts for Mr. Flanagan are
pro rated based upon his time in service. See “Compensation Discussion and Analysis” for a full discussion
of our Annual Incentive Bonus Plan and “Summary Compensation Table” for amounts actually earned in
fiscal 2013.
(b) Represents the grant-date fair value calculated under ASC 718.